Fair and anticipated questions about the applicability of autonomous cars to Canberra's transport requirements,
and a brief analysis of Capital Metro's business case for light-rail
Public transport in Canberra
- What's wrong with the ACTION bus service?
Canberra doesn't have the population or density to support an efficient "mass transit" system, whether bus or rail.
It isn't ACTION's "fault" that it fails to deliver efficient and convenient public transport; rather it is a consequence of Canberra's "bush capital" urban plan based on low density suburbs and town centres separated by extensive buffer zones.
For decades, planners sought to reduce the need for transport by encouraging employment and services in suburbs, group centres and town centres, but with mixed success. Recently however, an emphasis on the development of services and employment in Civic and Brindabella Park reversed this policy of decentralisation. Land development has continued at a rapid pace "at the fringe", in Gungahlin, West Belconnen and Molongo, all geographically remote from the growing employment and service centres. Predictably, demand for transport and associated costs and traffic congestion have increased.
- Can public transport ever work in Canberra?
Yes, but not public transport based on a "mass transit" model of a limited number of fixed routes running at infrequent intervals: Canberra's population and its density is too low to make a convenient mass transit network viable.
Urban planning should aim to reduce the demand for transport by placing services and employment close to residents. However, whilst planning is driven by other agendas, an efficient and universal transport infrastructure is even more important to fill the generated demand.
- Won't autonomous cars just continue Canberra's dependency on ever more roads?
No: autonomous cars allow existing roads to be used much more efficiently than current private cars during congested peak periods and hence counter the need for more and wider roads.
The ACT Government's Transport for a Sustainable City Managing travel demand section noted that "The ACT has very low vehicle occupancy rates. Increasing the number of passengers per vehicle, while increasing sustainable transport options and improving the efficiency of vehicles, will help meet emissions targets".
A summary of AustRoads data notes that the AM peak period car occupancy in 2009-10 was 1.15 people in Melbourne, 1.20 in Adelaide and almost 1.25 in Sydney (data was not reported for Canberra). It reports that implied car occupancy from ABS census data is slightly lower, and fell from 1991 until 2006. Moriarty and Mees showed a strong negative correlation between car ownership and journey to work car occupancy rates and in Melbourne between 1951 and 2001: the higher the levels of car ownership, the lower commuter car occupancies.
Assume Canberra's AM peak occupancy is at the top of this range, at 1.25. The simulation of a "very high" uptake scenario (750K trips per weekday) shows average AM peak car occupancy to Civic and Parkes of about 2.1. Simulated autonomous cars from high-population and more distant suburbs have even higher average occupancies (for example, around 2.4 from Kambah to Parkes) because there are multiple people wanting to travel to these same popular destinations and because the "cost" of multiple inter-suburb pickups allowing them to share the car is cheap in proportion to the trip distance. Journeys to "smaller target" destinations, such as Belconnen and ANU, still have average occupancies of 1.5 and higher.
Increasing occupancy to such levels greatly decreases congestion. For example, raising the average car occupancy for trips into Civic and Parkes from 1.25 to 2.0 reduces the number of cars travelling to those destinations by over 35%. If 80% of such journeys were undertaken using autonomous cars, 30% of traffic would be eliminated.
Furthermore, communicating autonomous cars can be "platooned" (travel with very small inter-car gaps), a technique which is capable of tripling the vehicle carrying capacity of lanes.
Shared autonomous cars allow optimum use of existing road infrastructure by both reducing the number of vehicles in peak periods and maximising efficient utilisation of roads.
In the medium-long term, urban planners should be encouraged to reduce the demand for transport by decentralising services and employment close to residents.
- But aren't cars the problem, whether autonomous or not? Bus and rail carry much greater numbers in less space!
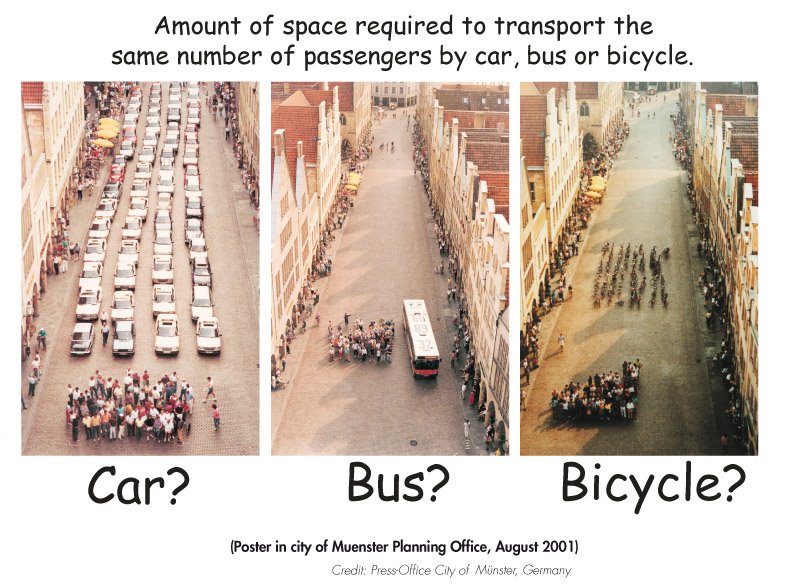
Yes, bus and rail can use the space in a transport corridor more efficiently, often meaning less land needs to be devoted to transport. In discussing autonomous cars, Jarrett Walker writes "Technology never changes facts of geometry!" and cites the image below.
Fleets of shared autonomous cars can increase the number of travellers per car from a typical 1.1 - 1.3 for private car commuter traffic to 1.8 - 2.2. Such an increase may well be still too small for almost all large, dense cities, and as a result, autonomous cars cannot replace mass transit in these settings. However, Canberra has a very good road infrastructure, only experiencing congestion for short peak periods, and even then at levels that would seem mild to commuters in Sydney or Melbourne.
The dramatic and widely cited poster purporting to compare "The amount of space required to transport the same number of passengers by car, bus or bicycle", sourced from Munster Planning Office, uses different "zoom" levels for car, bus and bike representations, and seems designed to deliberately misrepresent the areas required to promote a particular point of view. Here's the poster as cited:
However, as can be readily measured, compared to the bus view, the "same" road is about 32% wider for the bike and about 76% wider for the car view, greatly exaggerating the space taken by the bikes and especially, by the cars. Showing all forms at the same scale, with cars and bikes superimposed on the "bus" image:
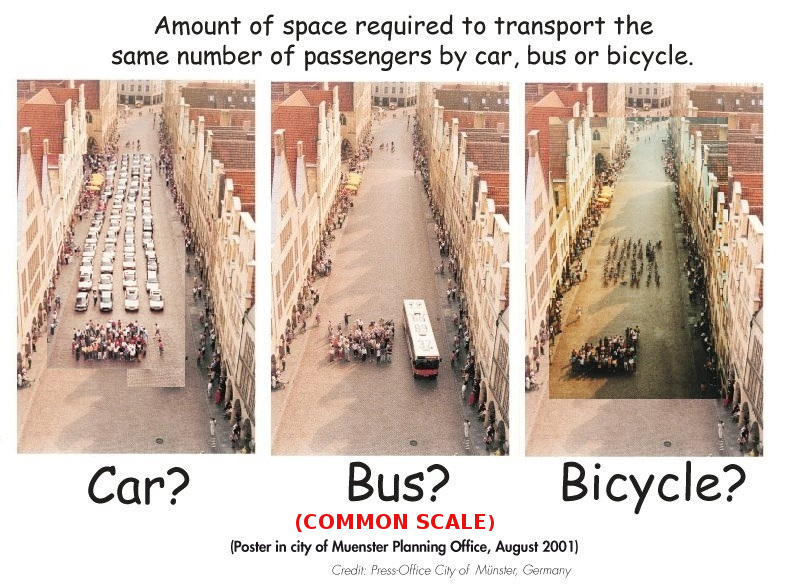
The original photo shows about 60 cars, but as you can see from the scaled version, the number of car passengers still seems worryingly larger than the number of bus passengers.
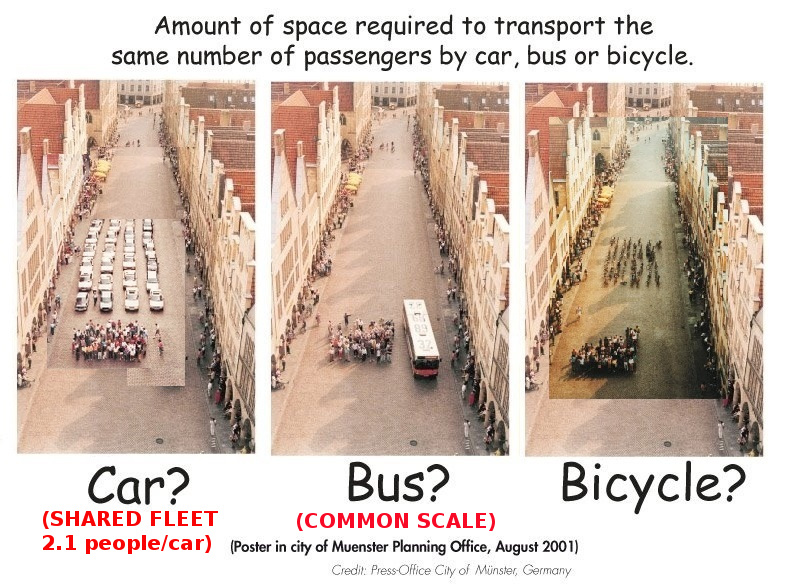
The original poster seems to assume an average car occupancy of 1 (60 people, 60 cars), which may be close to typical for private commuter cars. However, if, as the Canberra simulation shows, average occupancy of shared fleet cars in peak periods to popular destinations increases to 2.0 - 2.2, then perhaps only 28 rather than 60 cars are required, making a more accurate comparison poster look like this:
A more accurate representation of space used consistent with the "facts of geometry" must also consider average speed (all things being equal, buses tend to have lower average speeds than cars, and hence occupy a given area of road for longer), route (buses tend to take more circuitous routes, traversing a greater road length than an equivalent point-to-point car journey) and passenger comfort (on a typical ACTION bus, only 45-48, not 60 passengers can be carried seated, which requires just 12 "fully occupied" autonomous cars, that is, 3 rows of cars in the poster). If we compare space needed to transport 48 seated passengers, and assume that like the bus, the shared autonomous vehicles are fully occupied (that is, a "like for like" comparison), a different picture emerges:
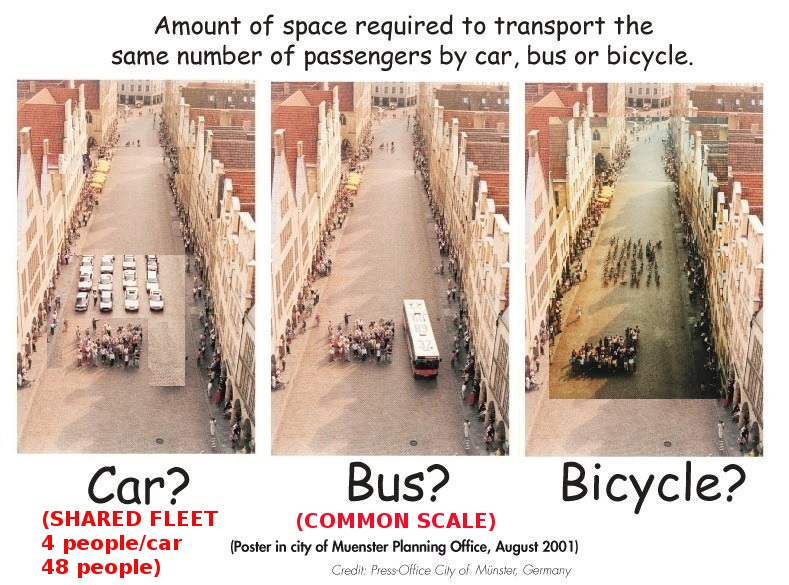
There is no argument that fully-loaded buses require less space than even high-occupancy cars to move commuters. There is however, a very compelling argument that for some cities, the social and economic advantages of on-demand, door-to-door, 24x7 travel greatly outweigh the single advantage of "less space".
- Aren't autonomous cars in opposition to the goals of "active transport"?
Active transport refers to physically active travel, such as walking and cycling which may be combined with traditional public transport, for example, by walking from home to a bus stop and from a bus stop to work or shops. The associated physical activity is likely to have health benefits, as well as reducing pollution, congestion, land required for car-parks, demand for new roads and public and private expenditure on transport.
The goals of active transport are very worthy. However, active transport should not be enforced unilaterally on those depending on public transport. Many people have health problems and disabilities which restrict their capability to participate in active transport. While a 10km bike commute is fine for many, simply having to walk 100m on an uneven footpath can be a serious impediment to mobility for someone with poor vision, severe arthritis or hip and knee problems. A walk to the shops or doctors may be a pleasant experience on some days, but less so in 40 degree heat or driving winter rain, particularly for the elderly and infirm or a single parent wrangling the toddlers and the weekly shop. Similarly, a walk back from the bus stop may generally be delightful on a spring afternoon, or may be a harrowing experience for a nervous and vulnerable young man or woman on a dark night.
Autonomous cars facilitate active transport by allowing the individual to add physical activity to their travel plans when and how it suits their circumstances. An aged pensioner may walk the 1.5km to the shops, but take a car home with their shopping. The visually impaired academic may walk 2km from home to a park each day and then be picked up by a car to travel to the door of their workplace to avoid negotiating crowded streets. The public servant may take a car from home to the lake and walk from there to their office (unless it is raining), and later jog home as far as they can before summoning a car.
Autonomous cars facilitate active transport by providing flexibility, opportunity and choice.
- But what about light-rail?
Essentially, the proposed light-rail line from Gungahlin to Civic is about turning green space in the centre of Northbourne Avenue into a "road for trains", then using the additional transport capacity to make a case for population growth and higher land values along the transport corridor, which in turn are used to attempt an economic justification for the project.
The extra peak-hour round-trips attributable to light-rail in 2031 according to the Capital Metro's business case total just 750, compared to commuter population of around 200,000 - less than 0.5% - a rounding error. But with a judicious choice of assumptions from the wide spectrum available within the contested field of transport economics regarding wider economic benefits, human behaviour and assumed technological (non-)developments over the next 30 years, it is possible to cherry-pick a scenario that results in a possible small net positive economic return for the light-rail project, whilst making barely a dent in the city-wide transport problem. [A brief analysis of the light-rail business case is included below.]
Canberra already has more than enough road capacity; we're just not using what we have wisely.
The proposed light-rail adds nothing to the existing bus options to meet the travel needs of most Canberrans, even those living in Gungahlin: consider the effect it has on the transport options of these typical citizens. By duplicating rather than reusing infrastructure, light-rail dilutes the effectiveness of spending on public transport. Light-rail is a distraction rather than a solution to a city-wide problem.
Dr Carleton Christensen's critique of the ACT Government's Transport for Canberra plan offers an interpretation of the philosophical underpinnings of the light-rail project, and how it concerned with changing Canberra's current urban form rather than implementing a transport strategy to meet the needs of the current "bush capital" urban form.
- But isn't light-rail popular around the world? What about the Gold Coast light-rail?
Light-rail and other mass transit approaches work extremely well in cities with high population densities.
Visitors to large cities such as Shanghai, New York, Paris and Madrid marvel at the efficiency and convenience of their mass transit systems and wish their home towns had a similar facility. However, it is a mistake to assume that what works in dense cities with populations in the millions will also work in a "bush capital".
The 13km Gold Coast light-rail has recently been completed at a cost of $1.6 billion. This line travels from Broadbeach in the south, through Surfers Paradise, Main Beach, Southport to the Griffith University and Gold Coast University Hospital in the north. The line passes through a relatively narrow residential, commercial and recreational strip with a population of 160,000 residents and a density of 1812 people/km2, which is also the major tourist destination in Australia. (About 12m people visit the Gold Coast each year.)
By contrast, the proposed 12km light-rail line route between Gungahlin and Civic is surrounded by a population of 110,000 (a figure which includes all of Gungahlin, some parts of which are over 7km from the terminus) at a density of 1372 people/km2, passing no significant tourist destinations (the National Dinosaur Museum and Cockington Green at Federation Square are a 35 minute bus trip distant from the proposed Gungahlin terminus). [Population data taken from ABS 3218.0 - Regional Population Growth, Australia, 2012-13.]
Attempts at providing an economic justification for light-rail have been debunked by those with a detailed and broad range of relevant expertise, including the Productivity Commission (see page 95 of the Commission's Public Infrastructure report), a former senior ACT Treasury economist (twice), a private economic research agency in a report prepared for the ACT Select Committee on Estimates, 2014-15 (see Chapter 3), an academic expert in public-sector cost-benefit analysis and a transport consultant (in a report commissioned by the ACT Liberal Party).
Politicians, like everyone else, know that the current ACTION bus service in Canberra is expensive and poor alternative to private car travel and that "something must be done". Some are hoping that light-rail will be viable, despite all evidence to the contrary and despite the mismatch of light-rail (or any mass transit) capabilities with the urban reality of Canberra and the needs of its citizens.
The ACT Government's Transport for Canberra: Transport for a sustainable city, 2012–2031 convincingly states the necessity of "Rapid Service" public transport along dense corridors using light-rail or rapid-bus with a minimum journey speed of 40km/hr. Capital Metro endorsed this requirement on its website last year (preserved by NLA's Pandora), claiming "The service will be a Rapid Service as defined in the Government's transport policy 'Transport for Canberra'. An average speed of 40 km/hr (including stops) is required for this service."
That commitment was silently removed before their Business Case was released, which aimed for an average speed under 29km/hr with a 5 minute peak-period service interval. In May 2015, this interval was silently stretched by 20% to 6 minutes, perhaps prompted by the realisation that the average speed will be more like Gold Coast's new light-rail's 22km/hr, and 12 trams isn't enough to provide a 5 minute service. Perhaps the next step in the marginalisation of public transport will silently redefine "Rapid Service" as 20km/hr to keep Capital Metro compliant.
Gungahlin residents deserve to keep the Rapid Service they and other Canberra bus travellers currently enjoy. Property developers excepted, all residents will be disadvantaged if the current light-rail proposal proceeds.
Perhaps an increasing knowledge of the capabilities of autonomous cars will channel the efforts of planners and politicans towards a more promising direction.
- Why does this matter?
It matters because:
Access to transportation is required for health, education, social interaction and participation in society. Without an effective and affordable public transport system, those unable to drive or afford a car risk social disadvantage. That disadvantage diminishes the whole society.
Continuing to satisfy the majority of transport requirements by building more roads to be used by private cars is neither economically nor environmentally sustainable.
The annual cost of road crashes in Australia is $27 billion, roughly $1150 per person per year. The annual cost of pollution from motor vehicles is estimated at between $1.5 billion and $3.8 billion. In Canberra alone, traffic congestion will soon cost $200M per year, according to ACT Minister Simon Corbell.
Compared to a fleet of autonomous vehicles, private cars and the current ACTION network are extremely expensive to run. By taking advantage of technology, we can simultaneously reduce our transport costs, reduce congestion, reduce pollution and provide fast and convenient transport to everyone.
Technology
- Autonomous cars don't even exist yet, so isn't this all pointless speculation?
Commercially available fully autonomous cars do not yet exist. However, a consensus has formed amongst transportation experts that their arrival is very likely within 5 to 12 years; experts such as:
management consultations including KPMG, Accenture, McKinsey, The Boston Consulting Group, Morgan Stanley,
think-tanks and research organisations such as The Eno Center for Transportation, IHS, The Conference Board of Canada, Columbia University's Earth Institute, and
car and technology manufacturers such as Nissan, Audi, Ford, GM, Daimler-Benz, Tesla, Volvo and Google.
The governments of Singapore and the United Kingdom are building national expertise in the design and operation of new and more efficient and effective approaches to transport based on autonomous cars.
Urban and transport planning deals with very long time horizons, and we need to be adequately informed when considering planning and investment decisions we'll have to live with and fund for many decades.
Just as we don't have to wait until 2 degrees of warming arrives before we start implementing plans to reduce climate change, we don't need to wait until autonomous cars are in show-rooms before working out how we can use them to develop cheaper and better transport.
- But didn't the experts polled at the 2014 Automated Vehicles Symposium say full automation was decades away, or never going to happen?
A commentary of the 2014 Automated Vehicles Symposium published by MIT Technology Review, Urban Jungle a Tough Challenge for Google's Autonomous Cars reported:
When surveyed by the conference organizers, the 500 experts in attendance were not optimistic such problems would be solved soon. Asked when they would trust a fully robotic car to take their children to school, more than half said 2030 at the very earliest. A fifth said not until 2040, and roughly one in 10 said "never."
The survey mentioned asked many questions of the participants; full details of the survey are available here.
Question 11 asked participants to forecast when systems would be deployed which would support "Automated driving on general urban streets, with the ability to ensure safety even if the driver is incapacitated", at a level of automation referred to as SAE Level 4. The median date was 2025, 1st quartile date was 2024, 3rd quartile date was 2028. About 3% said "never".
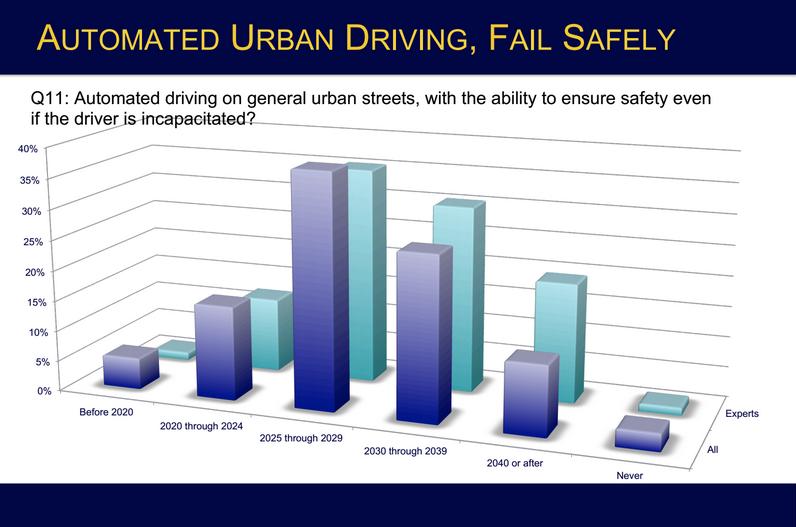
[Source: Automated Vehicles Forecast - Vehicle Symposium Opinion Survey, Steven E. Underwood, July 2014]At SAE Level 4, cars are not expected to be able to cope with all possible urban and rural road and all environmental conditions: that higher bar is represented by SAE Level 5. Most car manufacturers are currently planning for Level 4 systems, as systems with these capabilities will be able to cope with almost all conditions of urban and highway driving encountered by human drivers. There will be exceptional conditions that these automated systems won't be able to handle (just as there are exceptional conditions that humans can't handle), but in those conditions they will "fail safe", such as by pulling over and stopping on the side of the road.
Participants when asked to forecast when SAE Level 5 systems would be delivered gave a median of 2030, with a 1st quartile 2025, and 3rd quartile of 2035. Again, very few responded "never".
The "Kids to school" question which generated the most pessimistic response was "When do you expect to be able to trust a fully automated taxi to take your elementary-school-age child or grandchild to their school (with no licensed driver onboard)?".

[Source: Automated Vehicles Forecast - Vehicle Symposium Opinion Survey, Steven E. Underwood, July 2014]Why the relative pessimism? Perhaps the surprising answer is it is triggered by the perceived legal and regulatory problems rather than technology. The first question asked of the participants was: "What is your ranking of the difficulty of overcoming barriers in fielding SAE Level 5 fully automated vehicles in all environments, with the first column being the most difficult barrier and seventh column the least?". Even for this most demanding "all roads, all conditions, SAE Level 5" requirement, technology ranked as the only the 4th most significant barrier, with "Legal liability", "Regulations", and "Cost" all seen as being harder problems:
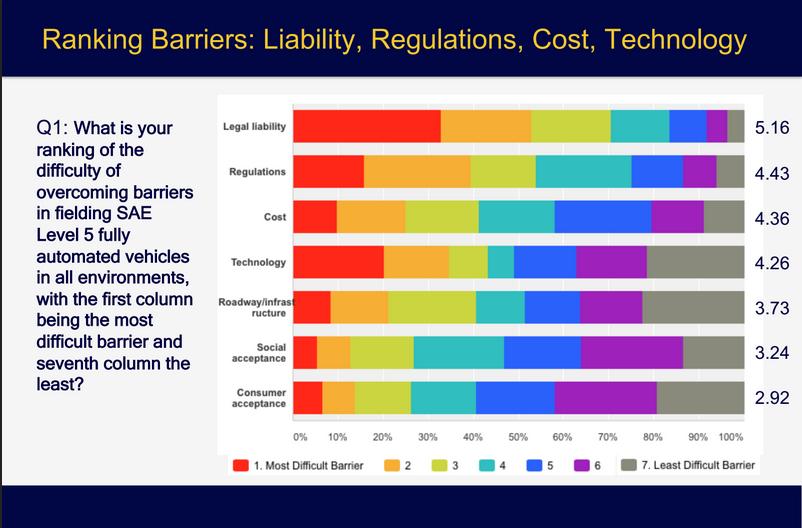
[Source: Automated Vehicles Forecast - Vehicle Symposium Opinion Survey, Steven E. Underwood, July 2014]If these results are accurate, the biggest hurdles which must be cleared before the benefits of autonomous cars can be realised are not technological, but primarily legal and insurance-related.
These big problems won't be addressed by the technical boffins in academia and the automotive and computing industries, but instead need to be tackled by the community and the legal and insurance sectors, and led by governments.
How good are these responses as predictions? In 1962, Arthur C. Clarke, writing in "Hazards of Prophecy: The Failure of Imagination" (part of "Profiles of the Future: An Enquiry into the Limits of the Possible"): "When a distinguished but elderly scientist states that something is possible, he is almost certainly right. When he states that something is impossible, he is very probably wrong." Perhaps Clarke was prompted by Lord Kelvin assertion in 1895, whilst President of the Royal Society, that "heavier-than-air flying machines are impossible", just 8 years before the Kitty Hawk. Or perhaps it was renowned U.S. inventor, Lee De Forest who asserted in 1957 that a return journey to the moon would never be undertaken by humans. Clarke certainly anticipated the then distinguished Microsoft CEO Steve Balmer who predicted in April 2007 "There's no chance that the iPhone is going to get any significant market share."
One thing Niels Bohr, Sam Goldwyn and Yogi Berra agree on: it's hard to make predictions, especially about the future. But it is rational to act for the best outcome based on the balance of probabilities.
The most significant force driving development of autonomous cars is commercial competition. Car manufacturers are competing for what they collectively see as the future of personal mobility. Established manufacturers are competing with the many new manufacturers based in China, and the "upstart", Tesla; European manufacturers are competing to develop systems independent from the American behemoth, Google.
Ford CEO Mark Fields, someone extremely motivated to be well-informed on the future of the car industry, stated in January 2015 "We believe in the industry that there will be a fully autonomous vehicle, probably within the next five years".
- Where is all the electricity going to come from?
Australian electricity producers have experienced a fall in demand which is expected to continue. As a consequence, there is significant generation over-capacity.
At the same time, ACT Government policy and the Commonwealth's Renewable Energy Target is encouraging the installation of electricity generation using renewables.
Australia has a vast capability to generate renewable power. Internal combustion engines can run on renewables (such as biodiesel), but it is generally considered that the consequences of diverting large amounts of crop lands to producing a transport fuel are unfavourable compared to renewable electricity production. The "future" simulation (1.1m journeys) requires about 3.4GWHr of electricity each day. By way of comparison, a typical aluminium smelter (such as Point Henry) uses about 8GWHr/day, and in 2011-12, average generation in Australia was around 700GWHr/day (255 terrawatt hours per year), and consumption in the ACT during 2013 was about 8GWHr/day.
- Aren't electric vehicles expensive and unable to travel far?
Electric vehicles are much more expensive than traditional internal combustion cars to purchase, but the difference in purchase price is continuing to drop. Electric vehicles are much cheaper to operate, and so an arrangement, such as a shared fleet, which maximises their use also defrays their purchase price over many kilometers, giving them a cost advantage. The default purchase price used in this model has been conservatively justified.
"Range anxiety" is often cited as a drawback of private electric vehicle ownership. However, electric vehicles operated as a shared fleet of interchangeable units do not suffer from this problem. An analysis shows a perhaps surprising lack of sensitivity of waiting times and operating surplus to battery range. A simulation using a smaller range car, the Mercedes-Benz Smart ED 2-seater delivers very favourable results.
Additionally, there is a great deal of research currently aimed at increasing capacity, power and cycle life of batteries whilst reducing their costs and operational temperature requirements, so whilst even current battery technology is currently adequate, it seems likely that in 5-10 years cheaper and better batteries will be commercially available.
- How are these vehicles going to charge themselves?
There is currently no commercially available electric vehicle charger that supports automatic charging at the rates required (probably 75kW). However, in principle this is an engineering problem which can be solved without a technology "breakthrough": its just a bigger Roomba "home base"...
Where charging happens is a more difficult problem. Perhaps some current undercover car-parks distributed around Canberra and close to high-voltage electricity feeds can be converted to recharging stations. The number of charging stations required increases from approximately 225 with the "ACTION level" uptake to 1500 with 750K journeys/day to 2150 with the 1.1M "future" scenario, assuming a 75kW charge rate.
BYD have commercialised some interesting bulk-charging approaches for buses and electric cars, including a "vertical charging carrousel" that simultaneously charges 12 electric vehicles in a 42 square metre footprint.
The Simulation
- How can 23,000 cars replace 200,000? How can wait times possibly be that good?
The "very high" uptake scenario (750K trips per weekday) shows that with all trip booking performed "on demand" (that is, without pre-booking to assist optimum car placement), typically over 98% of cars arrive to pick-up the traveller within 1 minute of the request being made. Further, less than 0.01% of travellers each day experience a delay of over 4 minutes. The scheduling system used by the simulation is very simple and could doubtless be improved (even at the peak minute in the simulation, over 10% of the fleet is idle, and the car sharing algorithm is not optimised).
So how can a fleet of 23,000 vehicles replace the journeys serviced by the Canberra fleet of over 200,000 passenger vehicles and over 400 buses?
The Appendix to the Columbia University's Earth Institute study, Transforming personal mobility, asked a similar question in relation to their independent analysis of waiting times for an autonomous car simulation based on an American city, Ann Arbor (page 40). In the Canberra context, their answer to this question would be:
The customer wait time and empty distance performance may seem unrealistic. How can a shared fleet get a vehicle to a customer spontaneously making a trip request with so little wait time? To answer this question, we need to think about where vehicles are when a customer requests a trip. In the peak period, the 23,000 vehicles are 89 percent utilized. That means that 11 percent of the vehicles (over 2,500 vehicles) are idle. With 2,500 vehicles spread over approximately 100 suburbs and 221 square km, there are about 25 idle vehicles per suburb, and about 11 idle vehicles per square km. In addition, there are about 800 cars completing a trip (including transfers) per minute and are available to serve customers. Therefore, there are a lot of vehicles available to serve trips even in a peak period.
Unlike the Ann Arbor model, this Canberra simulation attempts to combine passengers leaving from the same suburb and travelling to the same (or close) destination into shared cars, up to 4 per car. This model assumes that in peak periods the traveller "rents" a seat in a car, whereas outside peaks they "rent" the entire car.
Another key insight is that the private car fleet spends 95% of its time "idle", and some of the non-idle time is spent in congested traffic and finding car-parks. A fleet of autonomous cars (in the "high uptake" model) spend about 40% of their time on journeys containing passengers, about 9% on "empty running" to position for the next journey about 8% on charging (including travelling to and waiting for an idle charger) and about 43% idle. Further, during peak periods, the average occupancy of an autonomous fleet car is much higher than a private car.
Note that the model does not assume autonomous cars would enjoy faster journey times resulting from less congestion, although this is a very likely outcome and one which would further reduce waiting times for a given fleet size.
Other
- Isn't this incredibly risky?
Risk is comparative. Risky compared to doing nothing and experimenting with social outcomes associated with decreasing mobility of an ageing population and with lost opportunities and increased costs arising from poor access to transport? Risky compared to committing to $1billion on a light-rail project based on a very shaky cost-benefit analysis that at best will change the travel mode of less than 1 in 200 of Canberra's commuters?
The development of autonomous cars is the focus of many academic researchers and governments and every major car manufacturer. Think-tanks, bankers and management consultants are briefing clients on the massive changes their imminent arrival will bring. Competitive pressures are driving rapid development as auto-makers recognise that autonomous vehicles are the future of transportation.
The case for autonomous cars is well summarised by Matthew Inman, the person responsible for the popular The Oatmeal website. After a trip in a Google self-driving car prototype he wrote:
I'm biased. Earlier this year my mom had a stroke. It damaged the visual cortex of her brain, and her vision was impaired to the point that she'll probably never drive again. This reduced her from a fully-functional, independent human being with a career and a buzzing social life into someone who is homebound, disabled, and powerless.
When discussing self-driving cars, people tend to ask a lot of superficial questions: how much will these cars cost? Is this supposed to replace my car at home? Is this supposed to replace taxis or Uber? What if I need to use a drive-thru?
They ignore the smarter questions. They ignore the fact that 45% of disabled people in the US still work. They ignore the fact that 95% of a car's lifetime is spent parked. They ignore how this technology could transform the lives of the elderly, or eradicate the need for parking lots or garages or gas stations. They dismiss the entire concept because they don't think a computer could ever be as good at merging on the freeway as they are.
They ignore the great, big, beautiful picture staring them right in the face: that this technology could make our lives so much better.- Who are you? Why have you done this?
I'm Kent Fitch and I've lived in Canberra almost continuously since 1974. I've been a computer programmer with a small Canberra-based company, Project Computing Pty Ltd for over 30 years. I've worked on many finance, payroll and other admin systems for government and public companies. I worked at CSIRO and National Library of Australia over many years, and was the IT architect and programming lead on the NLA's digitised newspapers and Trove search system implementation. I also work on the AustLit literature database for UNSW Canberra and the University of Queensland. Current programming interests including large-corpus searching and automatic correction of OCR.
I have never been a member of any political party, and have nothing to personally gain from my advocacy of autonomous vehicles, other than promoting a belief in the benefits of an efficient transportation system for Canberra, and particularly in the social benefits of adequate public transport.
I found the study by Lawrence D. Burns, William C. Jordan and Bonnie A. Scarborough from Columbia University's Earth Institute, Transforming personal mobility compelling and wondered whether the results reported of a simulation of an autonomous fleet operating in Ann Arbor would translate to Canberra, which is both larger, less dense and has a distinct "tidal" commuter transport flow, and whether a fleet specified with conservative assumptions would be financially viable.
My email address is kent.fitch@gmail.com .
A brief analysis of Capital Metro's business case for light-rail
As noted above, the proposed light-rail does almost nothing to address Canberra's general transport problems and in particular, will not improve mobility for typical citizens. Hence, the debate on its economic merits and whether they are marginally positive, marginally negative, or so bad as to saddle future generations with crippling "availability payments" (jargon for an arrangement that previous generations might accurately characterise as "hire purchase", or "the never-never") is largely irrelevant from a transport perspective (and perhaps better considered, as Dr Carleton Christensen argues, as part of a discussion about Canberra's future urban form).
But not totally irrelevant because:
- The light-rail project diverts attention from the issue of effective and affordable public transport. It is
possible that light-rail is perceived by politicians and the public as "doing something" for transport, when the reality
as summarised
by David Hughes is:
To put this in perspective, at a cost of about $90 million a year under a public private partnership agreement, the project will change the commuting habits of 750 Canberrans by 2031. About 200,000 Canberrans travel to work each day.
The light-rail project diverts resources from an exploration of alternatives.
It is very likely that if construction of the light-rail proceeds, it will begin operation around the same time as trials in other cities of fleets of autonomous cars providing vastly cheaper and higher utility public transport options.
Commercial interests (and their bankers) will have foreseen this competitive threat and will have transferred the associated risk to Canberra rate-payers during the PPP ("public private partnership") contract negotiation. As Richard Denniss from The Australia Institute has pointed out in relation to the proposed light-rail PPP:
"..you pay someone to hide the debt for you. That is what a public-private partnership really is.
... Put simply, if the private partner knows more about running a light rail project it will use that knowledge to line the pockets of its owners, not to lower the cost to taxpayers. And if it does not possess such superior knowledge, then why would the taxpayer pay it a profit margin for doing the same job that public sector workers could do?"If nothing else, these notes may help prepare the representatives of Canberra rate-payers for this process, although by then the politicised context is likely to severely constrain their will and ability to negotiate, and so the "sunk-costs" in the light-rail are likely to construct a barrier to the entry of competitors, regardless of merit.
Demand forecasts made by transport projects are notoriously inaccurate, and those made by rail projects are the worst. Bent Flyvbjerg's frequently-cited study of the field in 2005, How (In)accurate Are Demand Forecasts in Public Works Projects? The Case of Transportation, noted:
The sample used is the largest of its kind, covering 210 projects in 14 nations worth U.S. $59 billion. The study shows with very high statistical significance that forecasters generally do a poor job of estimating the demand for transportation infrastructure projects. For 9 out of 10 rail projects, passenger forecasts are overestimated; the average overestimation is 106% ... Our data also show that forecasts have not become more accurate over the 30-year period studied, despite claims to the contrary by forecasters. The causes of inaccuracy in forecasts are different for rail and road projects, with political causes playing a larger role for rail than for road.
Hence it seems prudent to approach any rail business case with healthy skepticism.
Among the aspects of the Capital Metro light-rail business case which invite closer inquiry are:- Failure to keep "Rapid Service" commitment
- Economic justification is based on an assertion of unusually high non-transport benefits compared with other transport infrastructure projects
- Lack of clarity regarding the calculation of the agglomeration benefit
- Lack of consideration of technological impacts on transport and reliance on dubious congestion costs
- Lack of clarity regarding the calculation of travel-time savings, errors in hourly wage rate figures and optimistic forecasts for real wage growth
- Travel-time inconsistencies within the business case and with other ACT Government publications (current ACTION timetable, AECOM 2012 Transit Lane Warrants Study)
- Internal inconsistency of population growth estimate
- Community support for implicit population growth assumptions
- No error/uncertainty estimates for value of benefits
- Lack of evidence for the dependency of land use and wider economic impacts with this specific transport option, rather than population growth in general
- Double-counting of benefits because land value increases are primarily caused by travel-time savings
- Reliance on subjective and unsubstantiated argument
Appendix 1: Capital Metro light-rail travel-time calculations
Appendix 2: Capital Metro's EIS shows tram increases congestion and slows travel - but it is much worse than they admit
Appendix 3: Comparative emergency stopping distances and kinetic energy of car, semi-trailer and light-rail tram
Appendix 4: Capital Metro - Green or Greenwash?
Examples of how light-rail changed the Gold Coast street-scape
Analysis of Canberra Light Rail (Stage 1) Traffic Assessment report, February 2016
Failure to keep "Rapid Service" commitment
The Capital Metro website's FAQ page in March 2014 (courtesy of the Internet Archive, also in April 2014 version courtesy of NLA's Pandora) contained this commitment:
How long will the journey/s take?
The service will be a Rapid Service as defined in the Government's transport policy Transport for Canberra. An average speed of 40 km/hr (including stops) is required for this service.
The ACT Government's document specifying its "foundation for transport planning for the next 20 years", Transport for Canberra: Transport for a sustainable city, defines four service types. At the top of the pyramid is "Rapid Service", defined as:
Public transport corridors for all day, high speed travel across the city along dense corridors. Analogous to a metro or rapid public transport system, and location for future light rail or bus rapid transit. Rapid services carry the majority of passengers, and can help achieve mode shift goals for work trips and associated emissions reductions.
[Transport for Canberra, Table 2, page 19]The speed standard for "Rapid Service" is specified as ~40km/hr including stops.
Action item 17 of Transport for Canberra plan is:
Adopt an operating speed standard of 40km/hr for the rapid service to guide the infrastructure investment program [within 2 years]
Capital Metro adopted and publicised this goal in 2104, explicitly recognising the need to deliver rapid transport with an average speed, including stops, of at least 40km/hr. Yet the Business Case specifies a proposal delivering a 25 minute trip over the 12 km route, at an average speed of 28.8km/hr.
The proposed system hence falls far short of the ACT Government's own requirement for the "Rapid Service" it asserts is needed. Capital Metro's assertion that light-rail would meet this requirement was silently removed from their web-site by the time the business case was released.
Travel-time estimates (below and in Appendix 1) based on modern track, rolling-stock and service frequencies, and comparisons with Capital Metro's exemplar light-rail system, Gold Coast's G:link, strongly suggest the actual achieved average speed will be around 22km/hr.
Even with its extremely optimistic speed forecasts, Capital Metro will not be delivering the "Rapid Service" required by the ACT Government's transport planning strategy.
- Economic justification is based on an assertion of unusually high non-transport benefits compared with other transport infrastructure projects
Cost-benefit studies for transport projects typically count as benefits more than just direct transport-related efficiencies (such as time, fuel and cost savings). So-called "Wider Economic Benefits" are focussed primarily on "agglomeration benefits", which are net economic benefits thought to arise from greater efficiencies and hence productivity associated with increasing population and work-force density. The magnitude of agglomeration benefits are hard to quantify, and are a contested area in transport economics. It seems reasonable that greater physical proximity may allow businesses to communicate and operate more efficiently, particularly in the pre-internet era. It seems reasonable that larger co-located pools of employees and employers will increase the chances of the right person being in the right job, again, particularly in the pre-internet era. These benefits may outweigh possible disadvantages of greater density, such as less open space and parkland, greater noise pollution, congestion and increased spending per capita on law enforcement, and even higher rents resulting from increased competition for scarce land, for at least for some range of density increases, particularly in the pre-internet era.
A frequently-cited Australian study, Productivity and the Density of Economic Activity: Preliminary Estimates of Agglomeration Benefits in Australian Cities by Roman Trubka in 2005, used income as a proxy for productivity and attempted to correlate income (and through it, productivity) with employment densities for ABS statistical local areas (SLAs). Whether it is reasonable to correlate income within an area with productivity, and further, whether it is reasonable to assume that increasing income is caused by increasing employment densities is arguable - perhaps greater employment density in an area causes land to be so highly valued that the housing built on that land is necessarily higher-cost which is only affordable by high-income people. Trubka reported:The results of the analysis varied significantly among the major cities, producing elasticities and rsquared values that did not reveal uniform relations between productivity and employment size and density across the nation. This to some degree was expected because of a number of urban form characteristics that greatly differentiate the cities and because of the multitude of other contributors to urban productivity that cannot be captured in the dependent variables used. The inconsistency of the results among cities tells us that it is unlikely that we can generalise agglomeration benefits for infrastructure project appraisal across all Australian cities.
Nevertheless, the figures he derived are widely cited and used. His result for Melbourne was that elasticity of productivity with regards employment density was 7.4%: that is, a doubling of employment density would increase productivity by 7.4%, and hence increasing employment density by 10% would increase productivity by 0.74%. According to Trubka "The results for the rest of Australia's capital cities were more confounding and speculative, giving rise to some challenging questions."
Not surprisingly, agglomeration benefits have been eagerly included by proponents of transport infrastructure projects despite a rigorous understanding of how they can be reliably used and how they are affected by the increasing virtualisation of the economy. Infrastructure Australia, recognising the temptation to add wider economic benefits to a project's benefits, require a cautious and rigourous approach in their transport infrastructure investment framework template:
While it is recognised that the calculation of these wider benefits is still in its infancy, both in Australia and internationally, Infrastructure Australia believes the correct interpretation and accurate calculation of WEBs (using the most suitable data available) can add texture to the decision making process for certain initiatives. However, it is crucial to acknowledge that:
- Only certain initiatives, addressing a specific set of economic fundamentals, will generate WEBs;
- Significant WEBs will only be found in initiatives with strong traditional benefits, since WEBs require high levels of behaviour change, e.g. strong demand for the new asset WEBs may be negative for some initiatives; and
- the availability of Australian specific data needed to calculated WEBs is currently sub-optimal.
Therefore, Infrastructure Australia will treat WEBs separately to the traditional CBA. It is recommended that any proponent seeking to calculate WEBs consults with Infrastructure Australia before proceeding with the analysis. Any subsequent study should base the justification for inclusion of WEBs on the economic theory and applicability of this to the initiative's strategic objectives and impacts upon the transport and labour market. The quantitative analysis should follow the latest guidance and use well informed assumptions about the most appropriate, initiative specific data. Applying a broad percentage up-lift to the results of the traditional appraisal does not provide any additional or meaningful information for Infrastructure Australia to consider in the decision making process.
The Capital Metro business case introduces a further non-transport benefit by asserting that in addition to direct transport and wider economic benefits, the light-rail will add a non-overlapping set of benefits associated with increasing land values of properties located near the proposed transport corridor. Not surprisingly, some cost-benefit and finance experts have argued that the land values rise because of the travel-time benefits and the possible agglomeration effects, and that to include these again is a classic case of "double counting". And further, policies that promote higher-valued land use are independent of the light-rail proposal (or at least could be facilitated using cheaper methods such as busways or autonomous cars) and hence should be evaluated separately.
In this context, a reliance on high non-transport benefits to justify a positive economic forecast attracts scrutiny.
Transport benefits comprise a low proportion (41%) of the project benefits in the Capital Metro business case:
Benefit Component $m, current prices % Transport benefits 406 41 Land use benefits 381 39 Wider economic impact 198 20 Total 984 100 Comparable figures for other transport projects:
Project Transport benefits
as % of total
claimed economic benefitsEast-West Link, Melbourne 83 WestLink Melbourne 89 Melbourne Metro 75 - 80 Capital Metro light-rail 41 HighSpeedRail 2 (HS2 London-West Midlands) 82 Crossrail (London) 70 Jubilee line extension (London)
most recent assessment, 200464 [Sources: Job density, productivity and the role of transport, Victorian Dept of Transport, 2012, Agglomeration Benefits of the Melbourne Metro, SGS for Public Transport Victoria, 2012 and Economic Case for HS2: Updated appraisal of transport user benefits and wider economic benefits, A report to Government by HS2 Ltd, 2012]
The Canberra light-rail is a clear outlier: the next closest project (Jubilee line) has an over 50% higher ratio of transport benefits. Perhaps these non-transport benefits are justified by framing the project as an enabler of a changed urban form, rather than as a transport project. However, the lack of certainty of the robustness of assumptions which give rise to such abnormally high non-transport benefits, let alone the independent expert opinions of "double counting" and Infrastructure Australia's explicit cautionary notes on using such figures at all must give pause, for without such overwhelming non-transport benefits, the costs of the project greatly exceed the benefits. Even accepting the calculations of the transport benefits arising from the additional 750 peak and 750 off-peak daily public transport round-trips enabled by the light-rail in the business case at face value, the transport benefit-cost-ratio (BCR) of the project is 0.5, that is 50 cents benefit for each $1 of cost.
- Lack of clarity regarding the calculation of the agglomeration benefit
The Capital Metro Business Case assigns a present value of $165m to agglomeration benefits over to the life of the project. As mentioned above, the calculation and value of agglomeration benefits is a contested area in transport economics, and their inclusion as part of a cost-benefit analysis requires transparency as to their derivation. A critical parameter in their calculation which allows a comparison to be made between their use in this business case and theory is the elasticity of productivity with regards employment density. Table 61 of the business case lists many such "agglomeration elasticities", including those for agricultural, forestry, fishing and mining, which are unlikely to be applied. However, the source of these figures and how they have been used is not stated. Most significantly, nowhere is it stated what aggregate agglomeration elasticity parameter has been used.
Table 61 "Wider Economic impact assumptions" does contain a value for something labelled "Uptick for business user impacts" which could conceivably be the aggregate agglomeration elasticity, although there is no other reference to this label in the business case. Its value is given as 10%.
It is troubling if such a high figure as 10% has been used as the elasticity, especially without a careful justification, given that Job density, productivity and the role of transport (Victorian Dept of Transport, 2012) reports elasticities of 7% - 8% from Australian studies (and 4% from the Graham, Gibbons and Martin 2009 UK study).
If a figure of 10% has been used, it is possible that the agglomeration benefit, as theorised, has been over-stated by at least 25%, or $40m. A $40m reduction in benefits results in the project benefit-cost-ratio (BCR) including all transport, "land use" and "wider economic impact" benefits to be rounded down to 1.1, rather than be rounded up to the claimed 1.2
- Lack of consideration of technological impacts on transport and reliance on dubious congestion costs
The Capital Metro business case makes no mention on the impact of technology on the role of and demand for urban transport. However, much of the economic and social justification of a project running in parallel, the roll-out of the National Broadband Network (NBN), is based on behaviours it promotes which greatly reduces the demand for travel, such as:
- teleworking: the Australian Public Service have a goal to increase from 4% to 12% the number of employees teleworking at least one day per week. IP Australia's teleworking trial increased the number of hours worked by staff whilst teleworking from 7% in 2007 to 12% in 2013.
- home shopping
- home entertainment (streaming movies rather than visiting theatres)
- using video-chat to replace physical visits
- education (virtual classrooms and MOOCs)
- remote medical monitoring and diagnosis
- 3D printing
The likelihood of such comprehensive substitution of travel should be at least discussed in the business case.
According to the NBN media release, Canberra's connected commuters ditch peak hour for digital fast lane (NBN, September 2014), "New research shows better broadband will cut road congestion and increase worker flexibility". The media release quotes Stephen Greaves, Professor in Transport Management, The University of Sydney's Business School:
"Frustrated commuters who live in the suburbs and city outskirts stand to benefit most as they have the potential to significantly reduce the hours spent travelling to 'knowledge based' jobs traditionally located in the Canberra's CBD. This type of work typically deals in the trade of information rather than physical products or labour, and can be more easily done online from the convenience of our home offices or smart working hubs.
The flow on effect of this will extend beyond those working from home as less congested roads and public transport systems will mean better travel times for all."Transport and Urban planning consultant, Alan Davies, noted in July 2014 that
A draft Infrastructure Australia report says officially forecast traffic congestion is double what's actually happening; flawed methodology overstates the need for new urban roads.
He goes on to quote the Infrastructure Australia industry consultation draft, Spend More, Waste More, which is highly critical of the systematic overestimation of travel growth and congestion costs in Australian cities being used to justify unnecessary expenditure on roads.
In an earlier article (Will we drive a whole lot less in the future?), Davies discusses Bureau of Infrastructure, Transport and Regional Economics data which shows per capita travel started to level off in the mid 1990s and then fell from 2004-5:
..but I suspect the key explanation is the obvious one: we're increasingly substituting electronic communications for driving; we're making fewer trips.
For those with the ability to exploit the potential of technology, the warrant for driving is considerably weaker than it was 10 years ago. More and more transactions can now be done from the workplace or home (or anywhere) without the need for a travel.
It's possible, even likely, we're only witnessing the start of a sustained downward trend in travel, especially driving.There are very few details on the calculation of the single major transport benefit of light-rail, time-savings, in the Capital Metro business case, and no mention at all of how technological developments will affect demand for travel over the next 30 years of forecast benefits. However, careful consideration of such developments is vital for such a forecast.
The business case does rely on the Bureau of Transport and Regional Economics' forecasts that were refuted by the Infrastructure Australia industry draft report to claim that "the social costs of congestion could rise from $0.11bn to $0.2bn per annum for Canberra by 2020, based on "business as usual" projections of transport activity".
Although these congestion costs (according to Infrastructure Australia industry draft) may be greatly exaggerated, the Capital Metro business case is less clear on exactly what will be the effect of the net 750 extra peak period round-trips claimed by the business case (out of a Canberra total of 200,000) in reducing congestion costs. Will it reduce congestion costs from $200m per annum to, say, $195m per annum?
- Lack of clarity regarding the calculation of travel-time savings, errors in hourly wage rate
figures and optimistic forecasts for real wage growth
Travel-time savings, which at $222m (present value) over the life of the project, represent 55% of transport related benefits. However, it is not clear how the travel-time savings have been costed, and the business case seems to have used a "value of time" value 15% higher than Australian Transport Council (ATC) guidelines and to have used an optimistic forecast for real wage growth over the next 30 years.
The ATC National Guidelines for Transport System Management, Volume 5, 2006 state the work-time travel should be valued at the average wage rate, and non-work-time travel at 25-30% of this rate.
The business case assumes the value of time will grow by 1% per year above inflation, presumably on the assumption that real wages will also grow by that rate. However, it is optimistic to assume that real wages will grow at this rate, as over the last year Australian average wages have not increased in real terms. Real wages have not increased in the USA since 1964. Apart from unanticipated changes in political and social contracts regarding the share of surpluses distributed to wage earners, real wage growth is determined by productivity and the terms of trade, and the RBA's outlook for neither is optimistic. It is quite likely that the factors behind recent real wage growth in Australia will not be maintained in the short and medium term.
In these circumstances, the business case's assumption of the growth in the value of time and real wages is optimistic, leading to an over-estimate of travel-time savings.
[Incidentally, the business case sensitivity analysis in Table 30 erroneously states that a higher value of time escalation factor (1.5%) will result in lower BCR (1.1), when it will actually increase the BCR: a higher inflator on the value on time increases benefits over time and hence increased the BCR.]
Of even more concern are the wage rates used for the value of time calculations.
The business case states that the 2014 value of time is "$17.30 p/h for public transport users, $19.10 for car and $53.95 for commercial vehicles" and that those figures are "estimated in line with ATC national guidelines". However, those guidelines state that work time travel should be "valued at the average hourly wage rate (including income and payroll taxes)" (page 48). Average weekly wages in Canberra in May 2012 were $1357 according to the ABS. The national average hours worked is 31.6 ("all employees" hours were not broken-down to State level), giving an estimated hourly wage rate of $42.94/hr. Payroll tax in the ACT is 6.85%, and ignoring the payroll-tax threshold, this gives an estimated hourly wage including payroll tax of $45.88. (Not ignoring the payroll-tax threshold would result in a slightly lower hourly wage.) The business case is based on 2014 wages. In the two years since 2012, the Australian wage price index has grown by the annual trend rates of 2.7% (2013) and 2.5% (2014), (an average over the two years of 0.2% above CPI), increasing the estimated hourly rate in 2014 to $48.30.
The figure used in the business case, $53.95, is $5.65 or 11.7% higher than this estimate based on ABS data and the ATC guidelines.
According to the ATC guidelines, non-work-time travel should be valued at between 25% and 30% of the work-time valued. Hence, using the mid-point of 27.5%, the business case should be using a value of $48.30 * 0.275 = $14.49, rather than the $17.26 figure they are using. That is, the non-work time value used in the business case is 19.1% higher than it should be according to ABS data.
The business case constructs a weighted car travel time using 5% of the work-time value and 95% of the non-work-time value, of $19.10. When ABS supplied wage data is used, this figure should be instead be $16.18.
In summary, the business case uses inflated wage figures which must be deflated to accurately represent 2014 wages according to the ABS.
[Source: Table 53, Capital Metro Business Case and ABS wage data cited above]Travel time category Business case travel time values, 2014 More accurate travel time values, 2014
derived from ABS dataDeflator required to correct business case values Public Transport $17.26 $14.49 16.0% Private travel - car (95% of Car Total) $17.26 $14.49 Business travel - car (5% of Car Total) $53.95 $48.30 Car Total $19.10 $16.18 15.3% Light Commercial Vehicle $53.95 $48.30 10.5% Hence, as the vast majority of travel-time savings are derived from public transport and private car savings, and as travel-time savings are proportional to the value-of-time figures, the erroneous wage rate figures used in the business case alone have resulted in the travel time savings being overestimated by at least 15%. That is, rather than travel-time savings being $222m (present value), they probably are at most $189m.
Furthermore, assuming a less optimistic real-wage growth rate of 0.5% (rather than 1.0%) reduces hourly wages by 8% at the mid-point of the 30 year costing period (1.01^15 years/1.005^15 years), leading to a more realistic travel-time savings of $174m.
This more realistic estimate reduces total transport benefits from $406m to $362m resulting in a transport benefit-cost-ratio (BCR) of just 0.44.
The business case notes that the light-rail will enjoy signal priority over competing traffic. Additional traffic lights will also need to be installed. However, no discussion or details of the magnitude of the negative impact of these measures on travellers not using the light-rail is given, so it may well be that they have not been included in the nett travel-time savings calculation. However, as the vast majority of travellers traversing along and through the light-rail corridor will not be not using the light-rail, their negative time savings will greatly reduce and may even negate any savings if a complete calculation of travel-time savings were to be performed.
In addition to the factors discussed in this section, although the business case omits the relevant details, travel-time savings have almost certainly been based on travel volume estimates that fail to take into account technological developments and were based on outdated over-estimates from BITRE of personal travel (as discussed above). A more thorough analysis of the impact on declining per-capita travel is likely to significantly further reduce the asserted travel time savings, further eroding the project's claimed BCR.
Perhaps of most concern is the Capital Metro's Environmental Impact Statement which shows that in 2021 the light-rail project will increase congestion and travel times and significantly lower average vehicle speeds in the road network, and will increase the demand for extra traffic lanes and road-works to reduce congestion. An analysis of the EIS modelling is contained in Appendix 2: Increased travel times and congestion reported by Capital Metro's EIS, below.
-
- Travel-time estimates grossly inconsistent with Capital Metro's own rolling-stock requirements and service frequency
- 7am-6pm weekdays the services will run every at least every 15 minutes most of the day and every 6 minutes during peak.
- Weekends and weekday evenings at least every 15 minutes.
- The journey time between the City and Gungahlin is anticipated to be 25 minutes or less.
The Capital Metro website's Passenger Experience page states:
A frequent and reliable service
Capital Metro could run throughout the day and into the night, featuring high frequency services each day, with operating times such as:
The Capital Metro Business case section 3.1.2.8 states:
The rolling stock component of the project is likely to entail the provision of 14 light rail vehicles with capacity of approximately 200 people and a length of approximately 33 metres. This is the most usual currently available configuration for light rail vehicles. The light rail will have level boarding at all doors, priority seats for mobility impaired and designated areas for wheelchairs and pushchairs. The purchasing of 14 vehicles accounts for one vehicle assumed to be under maintenance and another for unscheduled repairs, with 12 light rail vehicles in service.
To summarise, Capital Metro asserts that 12 vehicles are required to service the peak load (with 2 purchased as spares) with a 6 minute interval vehicles.
If 12 vehicles are required to provide a 6 minute service interval, then it must take each vehicle 12 * 6 = 72 minutes to complete one round trip. A round trip consists of one trip in each direction, plus the turn-around time at the end of each trip. Based on similar services, such as the Gold Coast light-rail, the turn-around time should be 2 minutes per trip. Hence the 72 minutes is made up of two trips taking 34 minutes and two turn-around times taking 2 minutes.
That is, the assumption of trip time in the business case that drove the requirement for 12 vehicles (plus 2 spares) is that the single peak trip time is 34 minutes, not 25 minutes.
If the trip time was only 25 minutes, then the round trip time would be only (25 + 2) * 2 = 54 minutes, and so to meet the promised 6 minute service interval, only 54 / 6 = 9 vehicles (plus 2 spares) would be required.
It seems very unlikely that the Business Case would overestimate the number of vehicles, because with a purchase price of at least $4m-$5m per vehicle plus ongoing maintenance, they are very expensive and hence lower the project's benefit-cost ratio.
The inescapable conclusion is that the actual transport modelling which informed the business case's rolling stock requirements found that 12 vehicles were necessary for a 6 minute service interval because the transport modelling showed that the single journey time would be 34 minutes.
One can only speculate as to why a figure of 25 minutes was used instead. However, a journey time of 34 minutes is much longer than the current AM peak Red Rapid 202 service (19 minutes before 8am, 24 minutes after 8am), and such long travel times would reduce if not negate the travel-time savings on which the touted benefit-cost ratio is dependent and also negatively impact passenger demand with respect to the Red Rapid, as passengers would wonder "why stand for 34 minutes on light-rail when I could sit for 19 (or 24) minutes on the bus?"
Two independent ways of calculating the single trip times (one based on the Gold Coast light-rail experience and one based on use of acceleration, deceleration and maximum speed data, time spent at each stop and signal delays) generate estimates between 31.5 and 34 minutes. Complete details of these calculations are provided in Appendix 1 below.
- Travel-time savings inconsistent with ACTION timetable
The business case claims "Travel time on light rail will be approximately 23 - 25 minutes from Gungahlin to the City in the AM peak, with signalling priority, better than the existing red rapid bus travel time." (Table 11, Page 62)
This is the only occassion in which a light-rail journey time of less than 25 minutes is posited: elsewhere in the document, the "target" time is given as 25 minutes, for example: "The target journey time will be approximately 25 minutes in peak from Gungahlin to the City" (page 45)
Perhaps the possibility of a 23 minute journey was inserted to counter criticism that rather than being faster than the existing "red rapid" bus travel time, the light-rail's 25 minutes is actually 5 minutes slower than the the travel time of two AM peak "red rapid" services, and 2 minutes slower than average of the current non-stop "red rapid" services in the AM peak.
As noted above, Capital Metro's own peak rolling stock requirements (12 + 2) and peak service interval (6 minutes) implies a single journey time of 34 minutes, not 25 minutes. But for the following analysis, we accept the 25 minute figure.
The current ACTION Network-14 Red Rapid 200 timetable gives the departure and arrival times for 5 non-stop services (route 202, marked with an 'x' in the timetable) from the Gungahlin Town Centre to Civic in the morning peak period. The first leaves Gungahlin at 7:33 and arrives in Civic at 7:53. The departure and arrival times for the others are: 7:49 - 8:09, 8:04 - 8:28, 8:14 - 8:39, and 8:19 - 8:43. These five journey times in minutes are 20, 20, 24, 25, 24, giving an average of just under 23 minutes.
Outside peak hours, the facts are bleaker still for the light-rail business case. Even the normal (ie, stopping) "Red Rapid" service takes just 22 minutes for the trip from Gungahlin to the city at 10am, 1pm and 3pm and just 19 minutes at 9pm.
Thus, even based on Capital Metro's optimistic "targets" it is highly questionable that any travel-time savings for public transport users should be included in the "benefits" of light-rail, and more than likely, the time savings benefits will be negative for existing "Red Rapid" passengers forced to use light-rail.
- Modelling used to justify travel time claims is inconsistent with other measurements
The business case claims "Based upon micro simulation modelling performed in 20131, the current average Gungahlin to City morning peak travel time of approximately 35 minutes.." (page 51).
The footnote referenced states: "It is noted that the micro simulation modelling has been based upon the proposed rail corridor and Roads ACT travel time surveys. This modelling has not been used to calculate economic benefits, as these have been derived via strategic (macro) modelling. Micro simulation modelling has been based on highly detailed analysis of traffic flow on specific roads and intersections likely to be affected by the light rail route, whereas strategic modelling considers land-use models to predict the volume of demand and travel patterns".
Unfortunately, details of "strategic (macro)" modelling are not supplied in the business case. However, as noted above, the current average Gungahlin to City morning peak travel time for an ACTION bus is 23 minutes, not 35 minutes, invalidating all arguments and calculations based on that figure.
Perhaps the unstated argument is that buses travel faster than cars, because a bus transit lane runs for 1.3km city-bound on Flemington Avenue, and there is a short bus lane southbound just before the intersection of Barton Highway and Northbourne, that advantages city-bound buses over cars. [There are no such advantages for buses in the other direction, towards Gungahlin.]
To assess the magnitude of this advantage we can refer to the study of transit lanes commissioned by the ACT Government and undertaken by AECOM and published in 2012. Discussing the Flemington Rd transit lane, this study noted:
The results of the journey time analysis illustrate that there is a very minor difference between the observed journey times in the general traffic lane and the bus lane. The surveys show that the bus lane is approximately 9 seconds and 6km/h quicker than the general traffic lane over a distance of 1.3km during the AM peak period.
That is, the bus gains an advantage of 9 seconds over cars due to the transit lane. The study did not quantify the advantage given to buses from the short transit lane before the intersection with Barton Highway. However, even assuming cars suffer a total disadvantage of 2 minutes, that is, that a car journey along the bus (and light rail) route from Gungahlin to Civic takes 2 minutes more than a bus at the same time, then based on the ACTION "red rapid" non-stop AM peak services, the average car journey takes 25 minutes in AM peak, 10 minutes less than the journey time modelled by Capital Metro.
Both TomTom's route planner and Google Map's traffic journey estimators routinely give travel times of between 19 and 25 minutes for a car journey between Gungahlin Town Centre and Civic (Northbourne and Alinga) during the AM peak. Their selected routes for AM peak typically avoid Flemington Av in favour of Gungahlin Drive/Barton Highway.
The magnitudes of the claimed agglomeration and land-use benefits in particular, and to a lesser extent the travel-time benefits, are correlated with population growth. Without population growth, there are no agglomeration benefits even in theory, and no increased constant demand for land. Without population growth, any increase in demand for land along the transport corridor is offset by a reduction in demand (and hence value) of other land in the territory.
However the business case does not explicitly specify the vital population growth assumption. Perhaps the framers of the business case wished to avoid discussion on population growth, particularly as population growth is both essential to the assumptions suggesting economic viability and not favoured by the community.
Instead, the business case supplies two significantly different estimates for population growth:
- On page 56, an average population growth of 1.6% is assumed to justify the assertion that, if current land use policies are retained, "the existing supply of developable greenfield land within Canberra may be depleted within as little as 17 years if no action is taken". The growth estimate in this assertion may feed in to the calculation of urban densification benefits ($72m), land value benefits ($168m) and infrastructure efficiency savings ($140m). Because these components form such a large part of the claimed project benefits ($381m), the population growth estimate is a vital assumption that must be made explicit.
- On page 57, projected population growth is stated to be 1.2% between 2011-2021 and 1.0% between 2021-2031.
Presumably, only one population growth estimate has been used but the business case sheds no light on which one. Because these two assumptions result in a population difference of over 50,000 people by 2031 (equivalent to about a half-Tuggeranong), they imply significantly different futures for Canberra, and significantly different BCRs.
The Capital Metro business case is dependent on increasing population required by the theory of agglomeration effects, tax from the increased labour supply and land use benefits, contributing respectively $165m, $31m and $381m to the business case. The total value of these direct population-increase-related benefits is $577m, almost 59% of the total benefits.
Increasing population is also required for an increasing demand for transport (since BITRE have noted that per-capita travel has been dropping for 10 years), which drives the business case's travel-time and congestion related benefits.
In short, without significant population growth and acceptance of contestable assumptions about future urban planning and travel patterns, there is no possible business case for light-rail.
However, an explicit commitment to high levels of future population growth is notably absent from policy associated with the light-rail proposal.
A survey conducted by The Australia Institute in 2005, How Big Should Canberra Be? by Clive Hamilton and Claire Barbato, may explain this coyness. They noted that "[72 per cent] of Canberrans believe that the city's population should be no bigger than it is now". Less than 14% of respondents favoured growth beyond 500,000.
Implicit in the business case's required assumptions are that the population of Canberra will increase rise, to somewhere between 456,000 (~1.1% growth) and 508,000 (1.6% growth) by 2031. (It is unclear which growth estimate is used by the business case.)
The survey found that the negative impacts cited on quality of life with a Canberra population of 500,000 or more where:
- Environmental problems, like water shortages and pollution: 78%
- Traffic congestion: 53%
- Social problems like crime: 32%
- Pressure for inappropriate development: 28%
- Less friendly city/too anonymous: 10%
On the assumption that economic growth depends on population growth, the authors note:
One of the most common mistakes of the growth argument is that economic expansion is in itself beneficial. In fact, improving the average incomes of residents is a more meaningful (if still flawed) primary objective. Thus the focus should be on per capita growth not the overall level of growth. While higher population growth would undoubtedly result in a higher growth of total income, it is hard to argue that a faster rate of population growth would result in a faster rate of per capita income growth.
The Australian Greens' population policy does not argue for pursuing economic wealth by population growth, noting "Population policy should not be primarily driven by economic goals or to counter the effects of an ageing population" and "The continuing rapid increase in the human population has the potential to adversely affect national or international outcomes in environmental sustainability, human health and welfare, and other areas. Current rates of resource use are not sustainable and are compounded by inequitable distribution of wealth and power".
The support of the ACT Greens for a light-rail proposal that not only encourages but relies upon significant population growth for economic justification is puzzling.
The business case makes a considerable effort to quantify risks associated with the cost estimates, yet makes no attempt to quantity uncertainty associated with benefits.
In some respects, costs should be readily amenable to estimation: there is great experience with development both of transport infrastructure in Canberra and of light-rail.
Additionally, costs will be firmed by the tender/contract process, so variations should be safely identified before a contract is signed.
Benefits, on the other hand, take decades to realise, and are subject to the vagaries of technological development (which seem to have not been considered), human behaviour, population trends and wider economic forces. Further, the majority of the benefits of the light-rail arise from using contestable (and unclear) application of theorised benefits of agglomeration and other "wider economic impacts", the extensive use of which raises red-flags according to Infrastructure Australia guidelines.
Hence, a balanced and professional business case would identify, discuss and attempt to quantify the major uncertainties and risks associated with each benefit. For example, how are the claimed benefits affected by, and with what probabilities, the following reasonably likely conditions:
- the internet increasingly substitutes for travel
- planned increased development of employment in Gungahlin, Belconnen, Woden, Tuggeranong and Brindabella Park, reducing the growth in commuter traffic to Civic, Parkes and Russell
- population growth occurring at a lower rate than assumed
- the claimed agglomeration efficiencies not being achieved
- the popular uptake of shared autonomous cars for transport
- increasing land development beyond the ACT border
- negative economic and social outcomes attributable to population growth
- lower than expected uptake of light-rail due to the inconvenience of changing modes (for example, current Gungahlin->Russell/Barton "Red Rapid" travellers do not need to disembark on Northbourne, walk to the Civic bus interchange then wait for and board a separate service to their destination).
The business case leaves the reader with impression that the highest possible benefits have been calculated and "locked in". For example, "Light rail will lead to travel time savings: up to $222m million in present value terms ... over 30 years" on page 62 becomes "locked in" as a "bankable", 100%-certain travel-time savings of $222 in the BCR. Presumably the author of the "up to" statement was working on a probable range of travel time savings, of which $222m was the upper limit. (It is suggested above that an analysis of travel-time savings performed in accordance with ATC guidelines and latest ABS data shows that the maximum value of travel-time savings is likely to be much less, and population growth estimates and technology impacts may reduce this even further.)
Not providing error-bars and probabilities for any benefit components totalling $984m in the business case naturally raises suspicions that the benefits may be achievable only if all optimistic assumptions are accurate, all contingencies which may effect the benefits have been identified, there are no "unknown unknowns" and there will be no unexpected developments in human behaviour, technology and the economy in the next 30 years. Such confidence is hard to reconcile with experience.
Land use ($381m) and other wider economic impacts ($198m) comprise almost 60% of the benefits as calculated by the business case. However, no dependency is established between the specific transport option described in the business case, light-rail, and these benefits.
These benefits arise from two sources: land use changes and increased population, both of which could be facilitated by from policy changes which can be put in place independently of light-rail.
The assumption that the most economically and socially effective transport option to facilitate these two changes is light-rail is left unsupported by the business case. An earlier ACT Government submission to Infrastructure Australia demonstrated that these same outcomes could if desired, be facilitated cheaper and more flexibly by a dedicated rapid bus system, and this web-site presents strong evidence that autonomous cars can do the same, only much cheaper and more effectively.
"Land value" benefits of $168m are attributed by the business case to land along the light-rail corridor increasing in value. The methodology described in Table 25 only considers the land along that corridor: it does not consider the possibility that increased demand for this land may reduce relative and even absolute demand for and hence the value of other land in the territory, which would require an offsetting reduction in ACT land values as a whole.
More concerning is the high probability of double-counting, because the reason that land in this corridor may be more valuable is due to the perception of travel-time savings by potential buyers. But this benefit (travel-time savings) is already fully counted as $222m in the business case. To include it twice is an error.
As explained by Dr Leo Dobes who teaches cost-benefit analysis at the ANU Crawford School of Public Policy in A simple sanity check on Canberra's light rail project (Canberra Times, July 16 2014):
Increased property prices will occur if people living along the route value the availability of the light rail. Those travelling in different directions by alternative transport will not find it worthwhile to relocate to the light rail route.
Residents and developers who own land along the route before construction will gain in wealth, but those wishing to buy property will encounter greater expense. And assuming that prices do rise, there may well be an offsetting fall in prices in other areas as people move away from those areas to the light rail route.
Most important of all, counting increased property values as well as savings in travel time and the cost of petrol, would involve counting benefits twice. Double-counting occurs because increased property prices only occur due to the perceived benefits of reductions in costs. Prices would not rise otherwise.
"Urban Densification" benefits of $72m are attributed by the business case to:
- savings in electricity and water usage resulting from increased density
- "agglomeration and productivity gains similar to those captured as wider economic impacts by encouraging firms and workers to locate in closer physical proximity" (page 100)
No breakdown is provided as to the contribution of each benefit. The first benefit sounds reasonable: less electricity and water is generally used, but it is questionable how much of this is a economic benefit not captured by the separate benefit of increased land value. That is, given two properties, one of which requires the owner to use more water and electricity, other things being equal, then the more "efficient" property has a higher value.
The second "agglomeration and productivity" benefit seems indistinguishable from the usual benefits covered by the traditional agglomeration benefits, and also from travel-time-savings. As described, the "closer physical proximity" of firms and workers gives rise to precisely the agglomeration benefits separately accounted for under "Agglomeration benefits" ($165m) and as part of the travel-time savings ($222m)
Without a coherent explanation of why these benefits are not being included elsewhere, it is difficult to see why urban densification benefits are not also being double-counted.
Amongst the subjective and unsubstantiated arguments put forward in the Capital Metro business case are:
- Rail tracks are permanent
"The permanently fixed nature of light rail tracks which provide certainty for residents and investors. A quantifiable increase in residential and commercial property values has been demonstrated in areas in close proximity to light rail alignments. The same increase in land value does not occur from new bus routes." (page 71)
The implied contention is that a bus route could be removed from an area, leaving residents and businesses stranded without public transport. However, in what cases would this happen? Presumably, only if there was insufficient demand to justify the service.
As this long list of torn-up and abandoned Australian tram lines shows, rail has the permanence of a snow-flake in the Sahara. Large tram networks in Adelaide, Brisbane, Hobart, Perth, Sydney and many regional centres have come and gone, as have "heavy" rail lines. At the top of the imaginary competition ladder, "Australia's most transient transport infrastructure", is rail, just ahead of lighthouses.
- Light-rail is the way to attract young families to Canberra by promoting alternative housing options
"It is particularly important to attract young families to live in Canberra, where they will spend and support new business and services. To entice these families from larger cities, we must offer good employment and good, affordable living. While the landscape setting and environmental quality of our city is a drawcard, the lack of vibrancy in our urban environment, the limited range in housing and the cost of living can be discouraging." (page 54, quoting from the 2012 ACT Planning Strategy)
The business case proposes (and relies upon for economic justification) that housing density along the light-rail corridor will be greatly increased above Canberra's current average. It also seeks to create an environment that will attract young families to Canberra.
Young families were one of the demographic categories studied in the Grattan Institute's 2011 survey, What Matters Most? Housing Preferences Across the Australian Population. Figure 8 from their report reproduced here, shows that for this demographic to be attracted to Canberra, housing should match the characteristics of the typical current Canberra suburban dwelling:
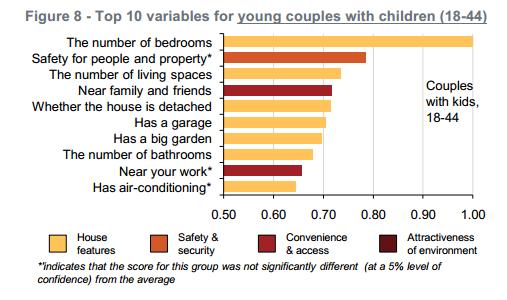
Figure 8 from What Matters Most? Housing Preferences Across the Australian PopulationLarge, secure, detached housing with a garage and big garden near family and friends is what these young families want. The Capital Metro business case asserts otherwise, but without supporting evidence.
- Light-rail enhances the "gateway to the Capital"
"Elements of Northbourne Avenue may represent a sub-optimal entrance to our nation's capital. Components of the original development that have taken place along Northbourne Avenue during the post-war year are visually unappealing, adversely impacting first impressions of the city.
The sub-optimal gateway to the capital:
- Provides a generally undesirable impression of the city, making it less attractive for occupants and visitors;
- Creates a utilisation problem, as Northbourne Avenue's density of development is low compared to other parts of inner-urban Canberra and other cities in Australia and overseas; and
- May contribute to lower property value growth along Northbourne Avenue." (page 59)The "original development" along Northbourne Avenue is the direct result of government policies. The business case augments the above commentary with this image of government-owned housing on Northbourne Avenue which has been left to run-down by the government:
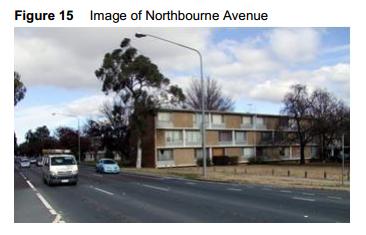
The government can readily redevelop or lease the land in question along Northbourne Avenue, setting whatever land use and planning restrictions the community wishes. This course of action is not dependent on light-rail. As the government's own submission to Infrastructure Australia showed, the "Bus Rapid Transport" (BRT) option could be implemented quicker and far cheaper (less than half the cost) with almost identical estimated benefits ($1187m for BRT compared to $1225m light-rail - Tables 52 and 53).
If anything, a busway would provide a more visually pleasing vista than the rails, overhead transmission wires and poles required by light-rail. Both median strip light-rail and busway require extensive visually-intrusive traffic lights and crossings to safely convey public transport passengers from the centre of Northbourne Av to the sides of the busiest road in Canberra.
It is hard to imagine either option improving on the current gateway, Northbourne's verdant median strip of majestic eucalypts hosting galahs and cockatoos.
The report prepared by URS for the ACT Government, City to Gungahlin Transit Corridor: Concept Design Report (April 2012) strongly recommended a kerbside, rather than the median alignment that has been chosen for the light-rail in Northbourne Avenue: "Kerbside bus lanes or light rail lanes have been selected for Northbourne Avenue between City and Barton Highway to enhance its unique character as the primary National Gateway. ... Only transit operation in the kerbside lanes strengthens the multi-faceted role of the Avenue by meeting its ceremonial, commercial, activity and travel roles" (pages 52-53).
Images of Northbourne Avenue, the "gateway to the Capital", that the Capital Metro business case decided not to use:

Looking south along Northbourne Avenue, at the intersection of Macarthur Avenue / Wakefield Avenue
[Source:Bidgee, Wikimedia Commons]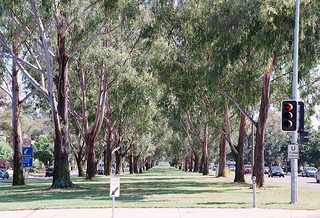
The green grass and trees of Northbourne Avenue, Canberra, njcull, Flickr, taken Dec 2012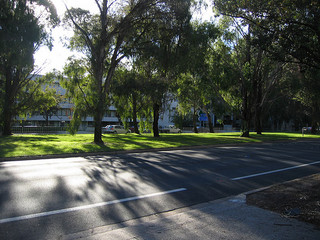
Late afternoon sunshine through the eucalypts on Northbourne Ave, Cimexus, Flickr, taken Apr 2008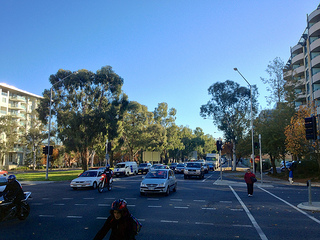
Morning traffic on Northbourne Avenue, Dave Sag, Flickr, taken Jun 2013Images of the Gold Coast light-rail that the Capital Metro business case decided not to use:
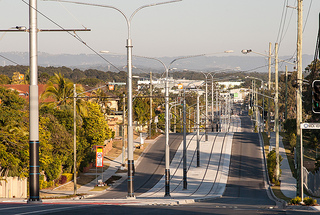
Poleland: The run down Queen Street to Wardoo Street. Not made any more attractive by the large number of service poles., Simon Morris, Flickr, taken Sep 2013
G:11 crossing the Sundale Bridge into Southport, bound for GCUH. Surfers Paradise skyline in the background, Darcy Reynolds, Flickr, taken Nov 2014

The ACT Government and Opposition have not reached consensus on light-rail, with the Opposition declaring that they will "tear up" any contract signed before the 2016 ACT Assembly election. But if the project does go ahead, it is preferable that both sides reach agreement on a contract that embodies both the Government's confidence that it will be successful and the protection that the Opposition is seeking that it won't be an expensive white-elephant.
Both goals can be met by changing the contract from being based on "availability" payments, as proposed by the Business Case, to "operational success" payments based on use; that is, a per-journey subsidy calculated by accepting the accuracy of the Business Case's projections.
The Business Case estimates construction costs of $783m and average annual (real) operating costs of $22.2m for the first 20 years. Assuming annual financing or equivalent asset holding costs of 10% ($78m) and a 5% profit on assets ($39m), the winning consortium hence requires annual revenue of around $139m ($22m + $78m + $39m). Assuming that the Business Case's projection of 6.37 million journeys in 2031 is the 20 year average, the real commercial cost of each journey is hence almost $22 ($139m/6.37m journeys).
Assuming travellers pay an average net fare of $2 per journey, a fair contract would require rate-payers to subsidise each journey by an average of $20. An up-front capital contribution from the Government does not change the effect of this subsidy on funds available for Government spending, but does obfuscate it (by reducing the success payment to the consortium whilst not providing any return on the Government's contributed capital or accounting for the opportunity cost of the use of that capital in other productive ways such as health, education and community services)NOTE 1.
Is 10% a realistic financing cost? The consortium bears all risks resulting from construction and operating cost overruns. Further, the Business Case estimate of construction costs ($783m) seems low in comparison with similar projects, and recent large civil engineering and construction projects in the ACT have a history of cost and time over-runs (GDE, Cotter Dam, Alexander Maconochie Centre, Constitution Avenue). The construction is inherently complex and risky, and the project is not popular with the community. There is the added element of "sovereign risk" based on the Opposition's promise to "tear up" the contract noted above. In addition, if the Business Case assumptions on travel times are to have any hope of being met, the trams will need to travel at speeds far in excess of those operated by the new Gold Coast service, or on the Dulwich Hill extension in Sydney (which runs using latest rolling-stock in a completely separated and dedicated right of way). Such speeds will necessarily incur an operational safety risk premium.
Given these risks, an investor would need to compare an investment in Capital Metro with the risk and 100+ year (long term) return from the ASX accumulation index, of 10%.
These calculations do not include the added costs of capital which must be borne by the consortium prior to completion when the first "availability" payment becomes due. They also do not include the additional revenue to repay the loan principal: if the principal is repaid, annual loan servicing costs on $783m over 20 years at 10% increase from $78m to almost $91m, requiring an extra $2 revenue per trip.
In the unlikely event that financing at 7% is secured, annual asset holding costs fall from $78m to $55m and annual revenue required falls from $139m to $116m, giving a real commercial cost of each journey of just over $18.
If, on the other hand, construction costs eventually come in at $900m rather than $783m, and financing can only be secured at 11%, and average patronage is 10% less than the optimistic estimate of the Business Case, then required annual revenue rises to $166m, and the real commercial cost of each journey rises to $29.
If the consortium (and their bankers) and the Government both believe the cost and uptake projections, and the Government believes wider economic benefits are worth more than the subsidy, and also agrees not to apply a greater subsidy to transport alternatives on the route and both agree to renegotiate the contract in 20 years based on an independent asset valuation, both the consortium and the Government will be motivated to sign. If the Opposition does not believe these projections, or that cheaper alternatives will immediately send the consortium bankrupt, they can rest easy that rate-payers funds will not be wasted.
The Capital Metro Business Case's claimed economic benefit-cost ratio of 1.2 is highly implausible. Even assuming the most optimistic cost estimates, it is extremely likely that the proposed light-rail will be a significant net drain on the ACT economy for many decades until it is abandoned. However, as ACT Government representatives are fond of saying when defending the business case, the benefit-cost ratio is just one input to the decision making process: it provides some important input but is not the sole factor. Yet in all other respects, the light-rail business case is deeply flawed and a major set-back to effective and sustainable public transport in Canberra.
The ACT Government's 2012 Transport for Canberra: Transport for a sustainable city, 2012–2031 built a compelling case for reducing the demand for transport through decentralisation of services and employment and for a hierarchy of public transport underpinned by "Rapid" high-volume transport routes. The Gungahlin-Civic "corridor" is identified as a high-priority "Rapid" transport route, to be serviced by public transport with journey speeds of at least 40km/hr (including stops). The existing "Red Rapid" bus services meets these requirements. Yet despite initial guarantees that the Capital Metro light-rail would also meet journey speeds required for a "Rapid" service, the Business Case aims for a journey speed of under 29km/hr. However even this slow, "non rapid" journey speed is extremely optimistic, as estimates based independently on Capital Metro's exemplar Gold Coast light-rail actual operations and on the likely route operating characteristics predict journey speeds of between 21/km/hr and 23 km/hr, barely more than half those stipulated in Transport for Canberra.
It is irresponsible for the ACT Government to countenance a flagship public transport investment that so comprehensively fails to meet the foundational underpinnings of their own transport planning blueprint. Gungahlin residents deserve to keep the Rapid Service they and other Canberra bus travellers currently enjoy. Property developers excepted, all residents will be disadvantaged if the current light-rail proposal proceeds unless the contract with the selected consortium is changed so that payments are based on operational success rather than "availability".
Consider the case where the Government makes an up-front capital payment of say, 50%, or around $400m. It may be argued correctly that doing so reduces the Consortium's borrowing costs, but it is wrong to conclude that as a consequence, the commercial cost of a single journey on the light-rail is reduced from $22 to $13. (Annual operating expenses of $22m plus annual interest expense on $400m of $40m, plus profit on 5% of $400 of $20m give a total apparent annual costs of $82m, which amortised over 6.37m trips gives a per-trip cost of almost $13.)
This mistake arises from not considering the opportunity cost of spending $400m as a capital contribution, that is, of not considering the opportunities forgone which could return a far better yield to the community than the 10% effective yield achieved by the capital contribution. For example, this $400m could be applied to provide:
- Better insulation and heating for community housing. $2000 spent on insulation and replacing gas heating with a heat pump typically returns much more than 10% pa in cost savings. Solar PV typically yields over 10%, as does solar hot water.
- Preventive health and dental programs are very cost-effective in reducing demand for intensive and expensive health services and improving quality of life
- Improving early education has a very high economic return, as does wider investment in education and training
- Prisoner rehabilitation programs are very cost-effective in reducing recidivism and improving lives
Alternatively, the ACT Government could just invest the $400m in an ASX accumulation index vehicle, and with a high probability, achieve a long term return of 10%.
So, if the ACT Government could not achieve savings, income, or benefits to the community of at least $40m per annum by investing a lazy $400m in improving services and facilities, then using $400m as capital to avoid additional "availability" payments of $40m per annum may be the appropriate thing to do. However, with so many worthy projects currently waiting for funding, this is not the case.
Note that the direct and wider benefits to the community provided by light-rail (and even whether it is net positive or negative) is a separate issue to this discussion, which is just about calculating the real cost of the provision of the service. Some component of that cost might be accounted as transfers of cash (by way of an availability payment), and some component might be accounted as a lost opportunity for more effective use of funds. Both components are equally "real" because it is the sum of both that determines the funds remaining to implement Government programs.
Appendix 1: Capital Metro light-rail travel-time calculations
As discussed above, the single trip time of 25 minutes is inconsistent with Capital Metro's own stated requirement for 12 operational vehicles (plus 2 spares) and a 6 minute service interval (or "headway"). Assuming a typical 2 minute turn-around time at the end of each single trip, only 9 vehicles (plus 2 spares) would be required if the trip time really had been modelled as 25 minutes.
Instead, the stated requirement for 12 operational vehicles (plus 2 spares) when combined with a 6 minute service interval implies that the single trip time was modelled as taking 34 minutes.
This appendix considers two independent approaches to estimating the single trip time which suggest a trip time of 25 minutes is extremely unlikely, and that 34 minutes is probably about right.
- Estimation based on the Gold Coast light-rail experiences
The Gold Coast light-rail was completed in 2014. Like the Capital Metro proposal, it uses the most modern rolling stock from Germany (Bombardier Flexity 2 trams), runs almost entirely in its own "right-of-way" from which other vehicles are excluded (including significant sections on a dedicated tram-way), uses dedicated stations with no-step vehicle entry and enjoys "high" (but not complete) signal priority.
Gold Coast light-rail has real time arrival information for trams at each station (http://ridetheg.com.au/stations/ - click each station for arrival times]. From this information, it can be deduced that on a typical weekday mid-afternoon:
- The complete route travel time from leaving Broadbeach South to arriving at GC Uni Hospital is 37 minutes (consistent with the G:link FAQ)
- The tram starts heading south 2 minutes later.
- A complete "cycle", for a tram just leaving Broadbeach South travelling north until it returns and just starts its next trip north, takes 78 minutes.
- The "headway", or interval between trams is just over 7 minutes. Hence, on a typical afternoon, 11 trams are servicing the route.
- The average speed of a single journey 21.1km/hr.
Gold Coast light-rail purchased 14 trams so during a typical mid-afternoon, 3 are not in service (maybe spare, under repair, not needed except in commuter peak). Their trams are long variants of Bombardier's "Flexity 2" vehicle, and are 43.5m long, 2.65m wide, carry 309 passengers (80 seated, 229 standing).
The Capital Metro Business case section 3.1.2.8 states:
The rolling stock component of the project is likely to entail the provision of 14 light rail vehicles with capacity of approximately 200 people and a length of approximately 33 metres. This is the most usual currently available configuration for light rail vehicles. The light rail will have level boarding at all doors, priority seats for mobility impaired and designated areas for wheelchairs and pushchairs. The purchasing of 14 vehicles accounts for one vehicle assumed to be under maintenance and another for unscheduled repairs, with 12 light rail vehicles in service.
A "Flexity 2" variant meeting these specifications is probably very close to the model described here: http://www.raillynews.com/wp-content/uploads/FLEXITY-2-Blackpool_datasheet_en.pdf
- 33m long, 2.65m wide
- passengers (74 seated, 148 standing at 4 passengers/m2) - capacity will be less if space is dedicated for wheelchairs, strollers and bicycles
- loaded weight: 56.7 ton
- max speed: 70km/hr
- acceleration (2/3rd load): 0.5m/s2
- deceleration (2/3rd load): 1.2m/s2
- emergency deceleration: 2.73m/s2
The Capital Metro route contains 13 stops including the 2 termini along a 12km route. The claimed 25 minute trip time implies an average speed of 28.8km/hr.
The Gold Coast light-rail average speed of 21.1km/hr traverses a route with a slightly greater "station density" than Capital Metro: 16 stations over a 13km route, or 1.23 stations/km. Capital Metro's ratio is 13 stations over a 12km route, or 1.08 stations/km. Hence, all things being equal, you would expect Capital Metro to have a slightly higher average speed, but interaction with other traffic and resultant maximum speeds and intersection delays are amongst factors which make things "not equal".
If the Capital Metro travelled at the same average speed as Gold Coast's light-rail, the 12km journey would take 34min 7 sec.
But as noted, Gold Coast light-rail has a slightly higher station density, basically 2 extra stations over the 12km run equivalent of Capital Metro. Detailed trip-time modelling below assumes 30 seconds "dwell time" per station, and approximately 32 seconds greater trip time per station attributable to acceleration and deceleration. Hence, a "like-for-like" comparison with Gold Coast's light-rail experience suggests an estimate of 32 minutes for Capital Metro.
However, Gold Coast's light-rail does have a considerable run of dedicated tramways (a major reason for its estimated $1.6billion cost), which probably allows it to reach a higher maximum speed than would be considered safe for Capital Metro which runs entirely through a busy traffic and pedestrian environment, so this estimate may be slightly optimistic.
- Estimate based on vehicle operating characteristics, station "dwell time" and intersection delays
Along Capital Metro's 13-station route, a journey in the shortest time involves 11 intermediate station stops, 12 accelerations, 12 decelerations, and 12 periods of maximum speed cruising.
What is a likely maximum speed? Although like the Gold Coast light-rail, the Capital Metro enjoys its own "right of way" (along Northbourne, Barton Highway, Flemington Rd), it is travelling through the centre of what is hoped to become a very densely populated environment (its raison d'être). It will be intersecting approximately 24 road intersections with cross traffic. Passengers and other pedestrians and cyclists will be in close proximity to the tracks: there is no "fenced off" area.
A considerable part of the rationale setting the speed limit of cars, especially in built-up areas, is braking distance. A car travelling at 60km/hr travels 16.7m/s. Braking from 60km/hr, assuming a 1 second reaction time and good road conditions, a typical family sedan travels a distance of 34m.
For the 57 ton Flexity 2 tram travelling at 60km/hr, emergency braking takes far longer than a rubber-wheeled car. It can't swerve either. With a 1 second reaction time and 2.73m/s2 emergency braking deceleration, the tram takes 1 + (16.7/2.73) = 7.1s to stop, during which time it travels a very long way: 16.7m + (2.73*6.1*6.1/2)m = 68m.
You don't want a 57 ton vehicle hitting a pedestrian-on-a-mobile, a fallen cyclist, a stalled car or anything at any speed.
At 45km/hr, the stopping time of the tram is 5.6 sec (including 1 sec reaction time), during which time it travels 41m. At 40km/hr, the stopping time of the tram is 5.1 sec (including 1 sec reaction time), during which time it travels 34m.
So, assuming traffic safety experts will stipulate that the much more massive, less manoeuvrable (unable to swerve to avoid impact, unlike a car or bus) and hence hazardous vehicle should have a stopping distance of no more than a car in this heavily traversed corridor, it seems likely that a top speed of 40km/hr (11.11m/s) should be enforced.
Even so, it is worth noting that a 57 ton tram travelling at just 11km/hr has more kinetic energy to transfer in a collision than a 1.8 ton sedan at 60km/hr.
Given an assumed maximum speed of 40km/hr:
- Acceleration to top speed will take 11.11m/s / 0.5m/s2 = 22.2s
- Normal (not emergency) deceleration will take 11.11m/s / 1.2m/s2 = 9.3s
- The distance travelled during 12 periods acceleration from stops and 12 periods of decelerations from stops is 2100m and will take 378s.
- The remaining 9900m of the 12km route is travelled at 40hm/h, taking 891s.
Hence total time "in motion" is 1269s, or 21m 15sec.
To find the total journey time (from when the tram leaves one terminus and arrives at the other), we must add "dwell time" at 11 intermediate stops plus intersection delays at the 24 cross-traffic intersections (and possibly additional pedestrian crossings to facilitate access to the centre-of-the-road stations to which all passengers, regardless of travel direction, must cross).
Dwell-times vary based on many factors including number of passengers embarking and disembarking, existing load, whether bicycles, strollers and wheelchairs are boarding or on board, number and width of doors per passenger, whether orderly patterns of embarking and disembarking are followed and time to open and close doors. During peak times with many passengers embarking and disembarking including some with bicycles and based on other rail and light rail dwell time studies, an average dwell time of 30 seconds would seem reasonable optimistic.
There is an interesting youTube video (well, "interesting" in the "slow televison" genre) of a complete early morning trip on the Gold Coast light-rail's first real passenger day. The journey takes 38min37sec, about 97sec longer than schedule, probably because it was the first day. You can't see how many passengers are on-board at the start, but apart from the first station (Broadbeach North, where the platform is well populated), the embarking passenger numbers do not seem very high (maybe it was very early in the morning).
The "dwell times" at each of the 14 stops were measured (in seconds) as: 69 51 36 38 69 25 27 42 30 30 32 28 39 52, totalling 548 secs, for an average dwell time of 39 secs per station.
Assuming the entire 97sec increase in scheduled journey time was solely attributable to the passenger numbers increasing scheduled dwell times (seems unlikely given the passenger numbers observed, but anyway...), reducing this total of 548 by 97 gives 451 seconds, for an average dwell time of 32 secs per station.
Hence, 30 secs dwell time per station seems reasonable, fair and consistent with the Gold Coast Light-rail experience.
So, we add a further 5m 30s dwell time across 11 intermediate stops to our "in motion" time.
Even with signal priority, there will inevitably be delays at intersections with many cars, pedestrians and cyclists crossing. The Gold Coast light-rail was given "high" but not "total" signal priority, and on the video you can see delays at a few intersections, with a combination of cars and pedestrians crossing in front of the tram.
Transit Signal Priority (TSP) is a tricky trade-off. Even if anticipated passenger numbers are reached in 2031, light-rail passengers in peak hour represent just a small proportion of total journeys traversing and crossing the 12km light-rail corridor. With a tram in either direction traversing each point at an average 3 minute interval, giving trams total priority would badly disrupt other traffic flows and destroy traffic light phasing.
TSP typically operates by slightly extending the green signal if the bus/tram is would otherwise just miss the green, or slightly advancing the green signal if the bus/tram is waiting for a green. [For an introduction to TSP, refer to Transit Signal Priority Operations (PDF presentation).]
There are several extremely busy intersections to be crossed: Barry, Macarthur/Wakefield, Mouat/Antil, Barton, Federal. As well, Wells Station intersection is becoming quite busy. Even 30 sec-60 sec delays at a few of these 6 intersections will "blow out" journey times, yet if every tram has priority at every signal, then other "majority" traffic will suffer, as will traffic-signal phasing, causing congestion and increasing overall travel times.
In the absence of published information detailing signalling priority, but noting that the Business Case states that signalling arrangements will "... [minimise] the impact on users of other modes of transport and pedestrians" (Table 4, page 25) and also "New traffic signals at ten locations are expected to be necessary to ensure that all vehicle movements across the light rail are signalised" (page 40), we assume perfect traffic synchronisation (with cautionary slowing down adding just 5 seconds to journey time) at each of 13 intersections, and much shorter than normal peak delays of 20 seconds at 11 intersections (including deceleration, acceleration and occasionally a very short wait). This optimistic calculation adds another 13 * 5 + 20 * 11 = 285sec, that is 4m 45s (although this level of signalling priority may be so optimistic as to imply significant delays for other vehicles, and hence be unacceptable).
Hence, these calculations give a journey time from leaving one terminus to arriving at the other of:
- running time: 21min 15sec
- "dwell time" at 11 intermediate stations: 5min 30sec
- intersection delay across 24+ intersections: 4min 45sec
for a total journey time of 31min 30sec at an average speed of 22.9km/hr.
This speed is 9% faster than Gold Coast's 21.1km/hr, but Capital Metro has a slightly lower "station density", so with otherwise similar technology and operations, a higher average speed may be expected (perhaps despite Gold Coast's dedicated sections of tramways).
Unfortunately, Capital Metro has not published the assumptions and modelling it has used.
Update August 2015:
The Capital Metro EIS (discussed below) includes traffic signal green time assumptions for 2021 which have been used to build this model of a AM peak period southbound trip.
In summary:
- The calculation based on Capital Metro's own published specifications on rolling stock and service frequency gives a travel time of 34 minutes.
- An extrapolation based on average scheduled travel times of the Gold Coast's similar modern light-rail system suggests a travel time of 34 minutes without correcting for Capital Metro's lower station density, and perhaps 32 minutes if this correction is performed.
- A calculation based on acceleration, deceleration, maximum speed, dwell-time and intersection delay assumptions suggests a travel time of 31 min 30sec.
All these times are much longer than the current peak Red Rapid 202 service over the same route from Hibbertson/Hinder to City Bus Station of 19 min (at 7:31am and 7:52am) and 24 min (at 8:16am and 8:38am) and of course, of the 25 minute figure asserted by Capital Metro. Unfortunately, the modelling behind this 25 minute figure has not been made public.
Travel times longer than those asserted by the Business Case will greatly reduce and quite possibly negate travel time savings assumed by the benefit-cost ratio. They will also adversely affect passenger demand, particularly as the most of the 200 passengers on board the tram during peak periods will be standing for the duration of their journey.

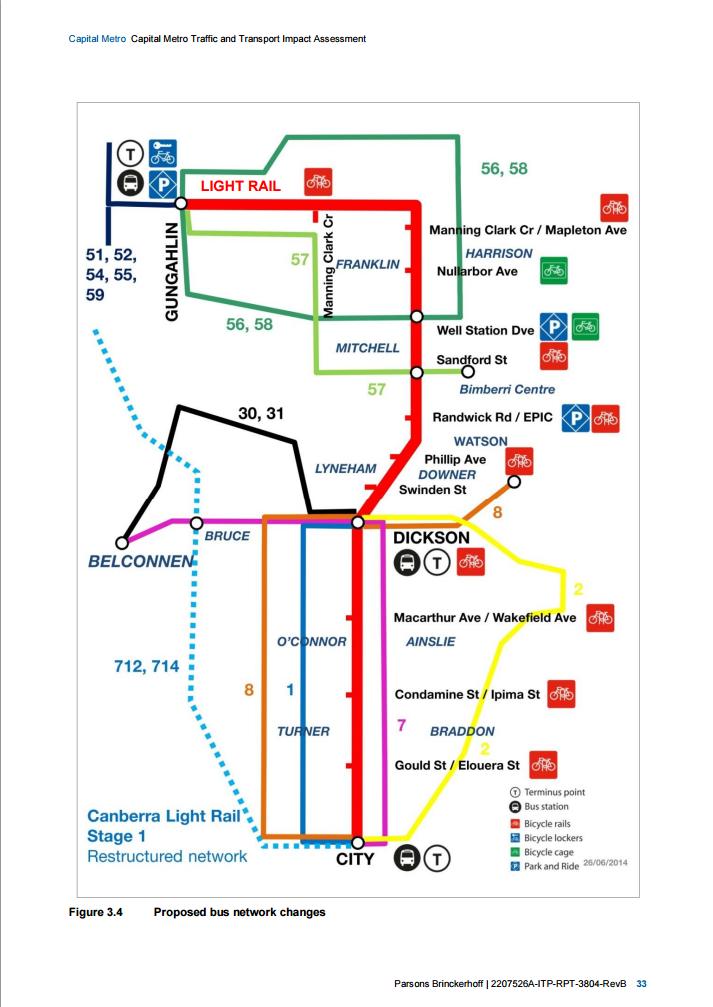