Contents
- Travel times, 2031 AM peak, along the route
- Vehicle volumes, 2031 AM peak
- The elephant in the room: traffic congestion will be much worse in 2031 than 2014 if the tram is built, and only slightly better if it is not built
Introduction
As part of the revisions to Development Application 201528511 released in February 2016, an updated traffic analysis was released ("Canberra Light Rail (Stage 1) Traffic Assessment Report" by Transport Modellers Alliance). Unlike the traffic analysis in the Capital Metro Environmental Impact Statement, this new analysis did not model traffic in 2021, and provided less detail (for example, light phasing timings were omitted).
However, like the EIS traffic analysis, it contains several serious errors (such as traffic taking unavailable turns and missing data) and several contentious but unexplained assumptions, some of which are examined below.
The report's "bottom line" for the 2031 AM peak is that across all 27 intersections modelled, the average delay will increase by 3 seconds per vehicle per intersection if the tram is built. As discussed below, this estimate of degradation is extremely optimistic and the actual delay is likely to be significantly higher.
The report claims that vehicle volumes will be slightly lower with the project, but due to unambiguous mistakes in the model as reported (in which some rows were mistakenly duplicated, described below), vehicle volumes will actually be slightly higher with the project, which when combined with additional signals, more and longer signal cycles and disruption to optimal signal phasing, results in significantly increased congestion, delays and transport costs.
That is, this latest analysis confirms that far from addressing congestion, given the modelled assumptions of growth in population and demand for transport, the proposed tram only exacerbates the problem.
1. Travel times, 2031 AM peak, along the route
The following tables extract traffic volumes and signal delay only for "through" traffic (the dominant traffic flow) along the route. The extract begins at the intersection of Manning Clarke and Flemington closest to Gungahlin Town Centre, because different traffic arrangements with the Project closer to the Town Centre make comparisons invalid at Kate Crace and Hinder (basically, the project has added traffic signals at those intersections, and with the project, normal traffic does not travel along Hibberson from Gungahlin Pl to Hinder. The extract ends at London Circuit. Hence, this table shows traffic volumes and intersection delays south-bound down Flemington to London Circuit in the AM peak. Traffic volumes are given as vehicles per hour, delays are given in seconds.
| Intersection | Base (no tram) | Project (build tram) | Increase in delay with Project (s) | ||
| vehicles/hr | delay (s) | vehicles/hr | delay (s) | ||
| Manning Clarke | 947 | 22 | 726 | 17 | -5 |
| Wizard | 974 | 15 | 786 | 26 | 11 |
| Mapleton | 917 | 137 | 950 | 42 | -95 |
| Nullarbor | 1042 | 52 | 1132 | 21 | -31 |
| Wells Station | 1192 | 67 | 1350 | 36 | -31 |
| AVERAGE Vehicles, TOTAL delay | 1014 | 293 | 1068 | 142 | -151 |
| Intersection | Base (no tram) | Project (build tram) | Increase in delay with Project (s) | ||
| vehicles/hr | delay (s) | vehicles/hr | delay (s) | ||
| Mitch ResCentre | 1336 | 13 | 1464 | 21 | 8 |
| Lysaght | 1157 | 0 | 1296 | 19 | 19 |
| Sandford | 864 | 24 | 996 | 60 | 36 |
| Randwick | 961 | 8 | 1100 | 1 | -7 |
| Showground | 966 | 2 | 1101 | 8 | 6 |
| Federal Hwy | 957 | 36 | 1107 | 48 | 12 |
| Phillip | 1681 | 16 | 1798 | 23 | 7 |
| Barton Hwy | 1409 | 50 | 1584 | 25 | -25 |
| Swinden | 1998 | 20 | 2713 | 22 | 2 |
| Mouat | 1765 | 89 | 1915 | 75 | -14 |
| Morphett | 2597 | 24 | 2751 | 11 | -13 |
| Macarthur | 1830 | 41 | 1884 | 58 | 17 |
| Ipima | 1840 | 23 | 1885 | 35 | 12 |
| Girrawheen | 1691 | 13 | 1915 | 14 | 1 |
| Elouera | 1693 | 4 | 1950 | 10 | 6 |
| Barry | 1357 | 28 | 1459 | 45 | 17 |
| Rudd | 1752 | 10 | 1831 | 32 | 22 |
| Alinga | 1872 | 7 | 1991 | 22 | 15 |
| London | 1499 | 7 | 1708 | 25 | 18 |
| AVERAGE Vehicles, TOTAL delay | 1538 | 415 | 1708 | 554 | 139 |
| AV/TOTAL ENTIRE ROUTE | 1429 | 708 | 1558 | 696 | -12 |
Observations on these tables
- The (tram) project increases vehicle volumes.
An oft-stated objective of the project is to decrease the volume of vehicles on the roads. Indeed, the source document quotes as the first objective of the project: "get people out of their cars and on to Capital Metro" and goes on to expand: "The addition of transport capacity in a way that addresses current traffic problems and integrates with other projects to revitalise urban areas and create a transformative urban living and working experience and allows Canberra to be free from a growing and unsustainable habit of car dependency, thus fulfilling Burley Griffin's vision for a truly liveable city." [Section 1.1]
However, as can be seen, the average vehicle volume travelling along the route increases by 9% from 1429 per hour if the tram is not built, to 1558 per hour if it is built. Average vehicle volumes increases along the route are even higher at 11% south of Gungahlin (Mitchell and North Canberra).
Hence, the proposed project fails to meet its objectives of decreasing vehicle volumes. Rather, vehicle volumes increase between 9% and 11%.
- Intersection delays as modelled are inconsistent, and most notably inconsistent with increased volumes.
As can be seen from the above tables, delays on the route are modelled as decreasing by 151 seconds between Manning Clarke and Well Station, yet increasing by 139 seconds between Wells Station and London Circuit.
All things being equal, increased intersection volumes translate into increased delays. In the Project case, increased volumes should make delays even worse because signal phasing needs to accommodate additional cycles to give priority to the tram, and to accommodate the much greater pedestrian traffic crossing the route to access the tram stations in the medium strip. Furthermore, the project requires these additional signals: Hibberson/Hinder, Kate Crace, Mitchell Resource Management Centre, Lysaght, Light Rail Depot, Randwick Road, Pedestrian Crossing at EPIC, Swinden Street.
And indeed, for 16 of the 24 intersections shown, delays increase. However, 8 intersections have smaller delays with the Project, and these decreases are so great as to outweigh the increases in the model. As discussed below, this outcome is not credible.
- Why the reduction of 95 sec at Mapleton is not credible
The base model shows a delay of 137 sec with 917 "through" vehicles on the route, compared to the project model of 42 sec with 950 vehicles. That is, whilst "through" vehicle volumes go up with the project, delays fall to one-third.
A possible explanation is that "downstream" volumes are greater in the base case, causing traffic to back-up at this intersection. However, this cannot be the case because as can be seen, volumes are lower along the route at ALL subsequent intersections with the base case, as far as London Circuit.
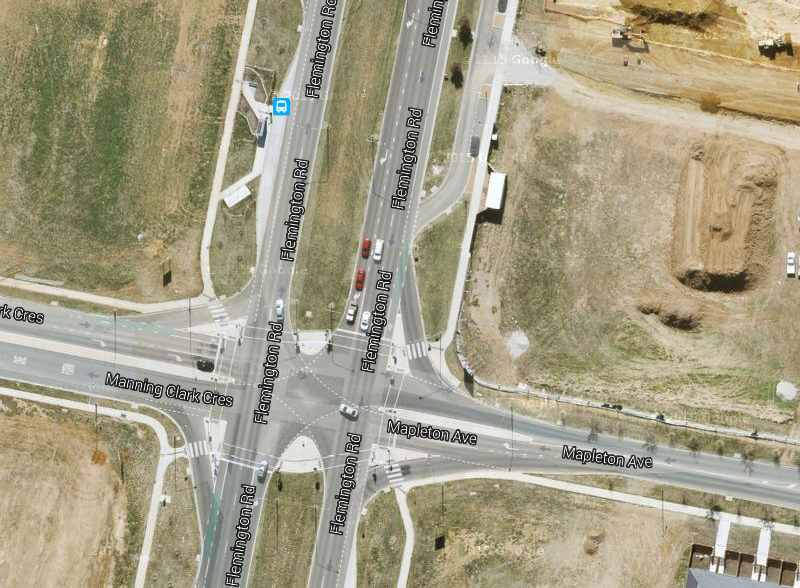
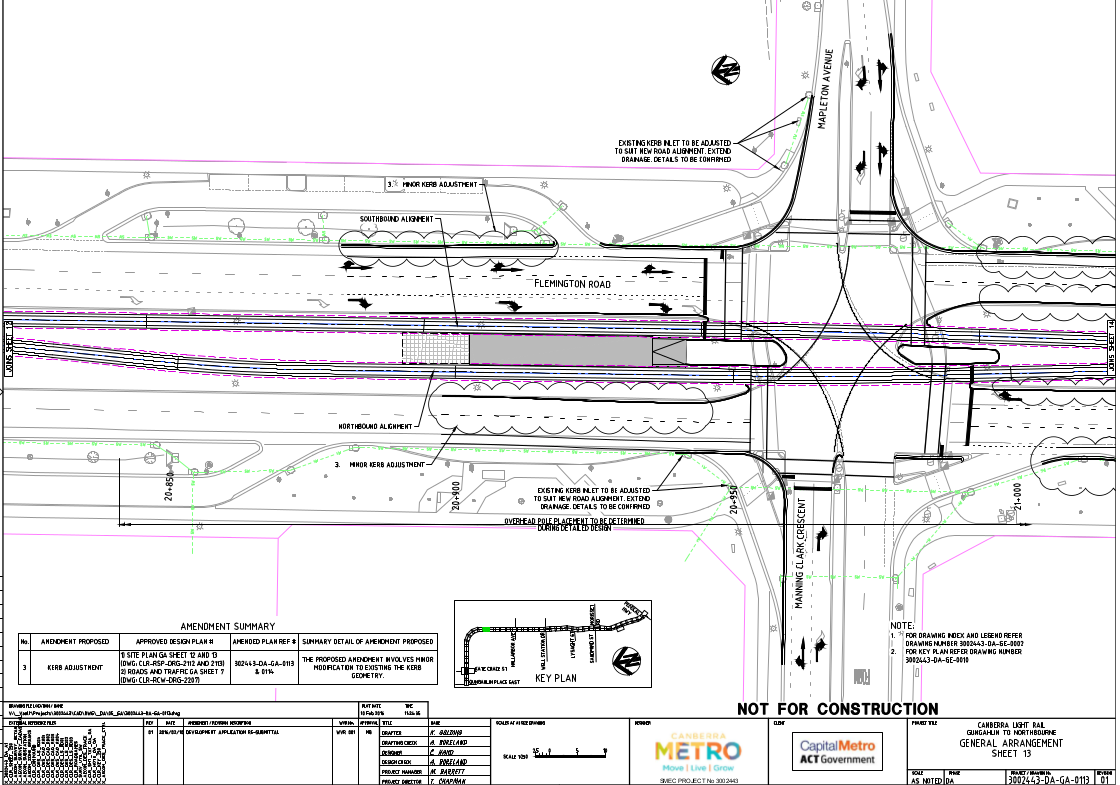
Another possible explanation is that the project case includes road-works to upgrade the intersection. However, the intersection diagrams show it looking much as it does now (same lanes, turning arrangements), so this is not the explanation.
Current
Tram
Another possible explanation is that the Project model more strongly favours the main route "through" traffic, penalising cross traffic. However, whilst through traffic (for example from Mapleton crossing Flemington) is slightly higher in the tram case (80 compared to 67 vehicles/hr), delays for that traffic are also lower for the tram case (60s compared to 63s with the base case). Indeed, looking at the accumulated delays at this intersection (accumulated delays for all traffic on all routes across the intersection, the model shows them as averaging just 46s with the project and 80s with the base case, despite the total vehicle volumes at the intersection differing by less than 4% across both cases.
A final explanation is that the traffic signals have been (accidentally) deoptimised in the base case. Unfortunately, signal phasing times have not been published, so this is impossible to verify.
In summary, there are no plausible reasons why the lower volume of through traffic in the base case (917 vehicles/hr compared to 950 vehicles/hr) would not result in shorter delays, not longer delays. Hence, when coupled with the additional signal cycles needed to accommodate the tram and additional pedestrian movements to the station at Mapleton, the intersection delay for "through" traffic at this intersection is likely to be higher with the project, not lower.
- Why the reduction of 31 sec at Nullarbor is not credible
The base model shows a delay of 52 sec with 1047 "through" vehicles on the route, compared to the project model of 21 sec with 1132 vehicles. That is, whilst "through" vehicle volumes go up by almost 9% with the project, delays fall to less than half.
As with the Mapleton case above, downstream volumes, roadworks and signal phasing to favour cross-traffic in the base case are not explanations (cross traffic is modelled as both having higher volumes and shorter delays in the project case). As with the Mapleton case, looking at the accumulated delays at this intersection (accumulated delays for all traffic on all routes across the intersection, the model shows them as averaging just 28s with the project and 47s with the base case, despite the total vehicle volumes at the intersection differing by less than 1% across both cases.
There are no plausible reasons why the lower volume of through traffic in the base case (1047 vehicles/hr compared to 1132 vehicles/hr) would not result in shorter delays, not longer delays. Hence, when coupled with the additional signal cycles needed to accommodate the tram and additional pedestrian movements to the station at Nullarbor, the intersection delay for "through" traffic at this intersection is likely to be higher with the project, not lower.
- Why the reduction of 31 sec at Wells Station is not credible
The base model shows a delay of 67 sec with 1192 "through" vehicles on the route, compared to the project model of 36 sec with 1350 vehicles. That is, whilst "through" vehicle volumes go up by over 13% with the project, delays fall to almost half.
As with the Mapleton and Nullarbor cases above, downstream volumes is not an explanation. However, cross-traffic volumes and delays (crossing Flemington along Wells Station) are higher with the project, which could indicate some extra signal priority being given to traffic along the main route. For example, traffic from Wells Station East crossing to Wells Station West increases from 255 to 341 (base to project), and their delays increase from 45s to 79s with the project. However, to perform a "like for like" comparison, this same relative signal priority should be given to traffic in both models.
As total intersection volume with the project is over 4% higher at Wells Station, it seems implausible that average delays at the intersection would go down. Hence, when coupled with the additional signal cycles needed to accommodate the tram and additional pedestrian movements to the station at Wells Station, the intersection delay for "through" traffic at this intersection is likely to be higher with the project, not lower.- Why the reduction of 25 sec at Barton Highway is not credible
The base model shows a delay of 50 sec with 1409 "through" vehicles on the route, compared to the project model of 25 sec with 1584 vehicles. That is, whilst "through" vehicle volumes go up by over 12% with the project, delays fall to half.
As with the cases above, downstream volumes is not an explanation: they are lower in the base case. The only cross-traffic in this case comes from Barton Highway turning right onto Northbourne. In the base case, there are 1104 vehicles crossing with an average 55s delay. In the project case, there are 1132 vehicles crossing with an average 68s delay. Hence, the project case signals may very slightly favour the "through" traffic at the expense of crossing traffic, but not enough to halve the delay. The latest drawings also show that it is not a case of roadworks at the intersection: if anything the merging lane just south of Barton intersection has been eliminated to accommodate a wider median, so this would be expected to increase delays in the project case.
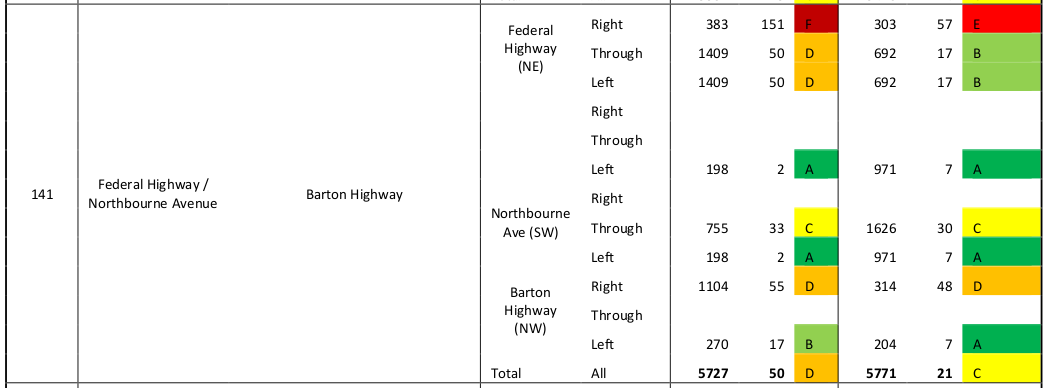
There is a hint provided in the "base" case model which points to a deep problem with the base case calculations. Below are fragments of the base and project information for this intersection:
Base
Project
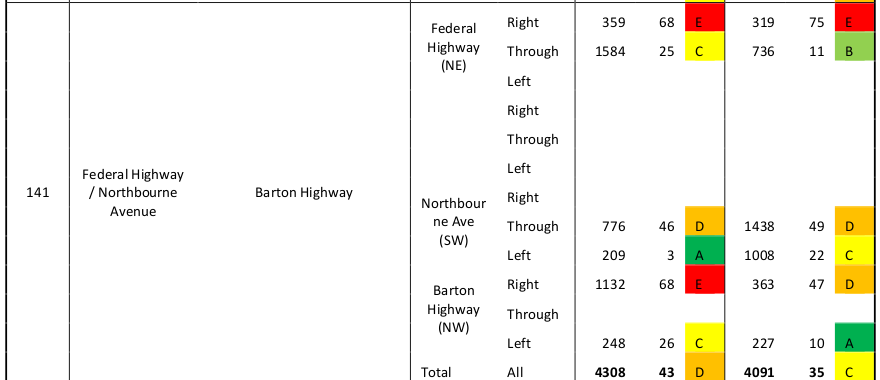
The columns are intersection number, intersection name, from direction, travel direction, and then 3 columns repeated first for AM peak and then PM peak: vehicles/hr, delay (s) and intersection rating (A for good to F for appalling). This discussion is only considering the AM peak information.
As can be seen, the base case contains 2 spurious rows: turning left from Federal Highway when approaching from the north (which would currently send you into a row of trees), and a non-existent (unnamed) approach road with a mysterious left turn. Both of these rows are duplicates of the Federal (North) "through" row (1409 vehicles/hr) and the Northbourne (S) turn left onto Barton row (198 vehicles/hr). As can be seen, these mistakes are repeated in the PM columns. These mistakes inflate the intersection volumes to 5727 vehicles - the correct figure is 4120 vehicles.
So, the base intersection combined volume is 4120 vehicles, and the project case volume is 4.5% higher: 4308.
As total intersection volume with the project is over 4% higher and "through" traffic on the route is over 12% higher at Barton it seems implausible that average delays at the intersection would go down, let alone halve. Hence, the intersection delay for "through" traffic at this intersection is likely to be higher with the project, not lower.In summary, there are no plausible reductions for "through" delays at the four intersections examined of 95s, 31s, 25s and 25s with the project case. Instead, at all four intersections, the analysis suggests delays will be longer with the project case due to increased traffic volumes and signal delays. These 4 intersections alone will hence contribute an additional 176s delay on the route from that claimed by the latest model. Other intersections with claimed on-route improvements such as Mouat (14s less delay despite 15% more traffic at the intersection), Morphett (13s less delay despite 6% more traffic at the intersection), Randwick (7s less delay despite 4% more traffic at the intersection) are also very likely to be reversed because in each case, traffic volumes are higher (often considerably so) and signal cycles will be longer to accommodate the tram and greater pedestrian movement.
Hence, rather than a modelled 12 second reduction in intersection delays over the route, the reality is likely to be at least a 200 second increase in intersection delays attributable to the tram project.
2. Vehicle volumes, 2031 AM peak
The "Canberra Light Rail (Stage 1) Traffic Assessment Report" accumulates the total traffic volume over all intersections along the route for both 2031 "base" and "project" case. This AM peak volume is 85121 vehicles/hr for the base case and and 84619 vehicles/hr for the project case (Tables 3 and 4). However, the "base" case volumes contain at least 3 obvious errors:
- 628 vehicles/hr at Flemington E at Wizard intersection (duplicated row)
- 1409 vehicles/hr at Federal (NE) at Barton turning left (duplicated row)
- 198 vehicles/hr on unnamed (non-existent road) at Barton turning left (duplicated row)
Hence, 2235 vehicles/hr have been erroneously added to the "base" case, and the corrected "base" figure is 82886 and hence 1733 vehicles/hr below the "project" case volume.
However, there are many other inconsistencies in the base-project data that suggest the increase in volumes in the project case may be slightly higher, such as:
Federal Highway (approaching from north), turn right onto Flemington: "base" case is 113 vehicle/hr, "project" case is 87 vehicles/hr. It is hard to explain why this 23% fall would occur if the tram is built, as the origin of this turning traffic is distant from the tram line.
Federal Highway (approaching from north), turn right onto Barton Highway: "base" case is 383 vehicle/hr, "project" case is 359 vehicles/hr. It is hard to explain why this 6% fall would occur if the tram is built, as the origin and destination of this turning traffic is distant from the tram line.
Macarthur Av crossing Northbourne to Wakefield: "base" case is 616 vehicle/hr, "project" case is 585 vehicles/hr. It is hard to explain why this 5% fall would occur if the tram is built, as the origin and destination of this crossing traffic is distant from the tram line.
Barry Dr turning right at Northbourne: "base" case is 387 vehicle/hr, "project" case is 329 vehicles/hr. It is hard to explain why this 15% fall would occur if the tram is built, as the origin or destination of this turning traffic is distant from the tram line.
There is a further problem in the accumulated vehicle/hr intersection data in Tables 2 and 3 of the Traffic Assessment Report: the first two intersections (Gungahlin Pl, Hinder) will have incomparable traffic flows with the "project" case, as the road between them (Hibberson) will be closed to normal traffic and traffic will use intersections not included in the vehicle accumulation totals. The net result is to favour the "project" case by about 230 vehicles/hr, most of which will be spread across other (unmodelled) intersections.
In summary, for the AM peak period, after correcting for the large and obvious errors in the Traffic Assessment Report, total vehicle volumes accumulated across the modelled intersections will be at least 2000 vehicles/hr higher if the tram is built.
Another error in the model which affects intersection delay times is a consequence of the incompletely modelled removal under the project of right turns from Northbourne (southbound) at Rudd, Alinga and London Circuit. The project model has zero volumes at all three intersections, suggesting no right turns will be allowed. However, to compensate, the 194 vehicles turning right at these three intersections with the base case will presumably need to turn right at the last possible location before the Commonwealth Av Bridge, and that is at Barry Drive. (Alternatively, these 194 vehicles could turn left at London Crt, and loop around to the west, but the left turn volumes at London show no increase with the project, so that has not been modelled.) "Through" traffic from east to west of Northbourne at Rudd, Alinga and London is 6% higher with the project, so the "demand" to travel to West Civic is clearly still present in the project model, so it seems these extra 194 vehicles turning right have just been mistakenly omitted from the project model.
If re-added, they will increase the right turn volume at Barry from 334 (base) to at least 589 (project), a 76% increase in right turn traffic volume at Barry with the project, which will further increase delays at this intersection for this turning traffic (having to cross the tram), Northbourne northbound traffic (having to wait for this turning traffic) and cross traffic even more than the modelled increase (which already shows average delays at this intersection increasing by 23% with the project compared to the base 2031 model).
3. The elephant in the room: traffic congestion will be much worse in 2031 than 2014 if the tram is built, and only slightly better if it is not built
Despite numerous errors in the "base" and "project" models, there is one very clear message from the "Canberra Light Rail (Stage 1) Traffic Assessment Report": between 2014 and 2031, in the AM peak, vehicles per hour using intersections along the route will almost triple and average intersection delays along the route will at least double. Traffic will be slightly more congested/delayed if the tram goes ahead, but the tram makes things only marginally worse.
It could be argued that the model is flawed: looking 15 years into the future at a time of rapidly changing technology is fraught, and the forecasts for population growth, distribution of housing and workplaces and the demand for and usage of transport are almost certainly, all wrong. Work, shopping and study are all moving relentlessly "on line", a trend not considered in any of the Capital Metro planning documents. The Government could decide to promote more distributed services and workplaces, rather than the current fashion for concentrating employment and facilities in and around Civic.
But if the results of this traffic model are to be used as justification for anything, the inevitable conclusion must be that the proposed tram project is not the solution to Canberra's forecast traffic congestion it was prompted as being: as the model shows, it makes it even worse than the "do nothing" base case. That is, the results of this traffic model make it clear that a different approach is required.
This outcome is not surprising, as the addition of many traffic signals, signal priority for the tram which especially penalises the large volumes of traffic crossing the tram lines as well as damaging phasing flows for "on route" vehicles (necessary to give priority to trams travelling in both directions at average speeds different from road vehicles), and the very large numbers of pedestrians required to cross the route to access the tram stations in the medium strip, all reduce usable road capacity.
Separation of the rail from vehicles ("grade separation", as implemented by the Dulwich Hill light rail extension in Sydney and by almost all heavy rail systems) solves the degradation in road capacity, but at great expense. One approach now being widely discussed and modelled by urban and transport planners is based on a shared fleet of autonomous electric vehicles. Modelling shows that this is a particularly appropriate approach for Canberra, addressing congestion as well as the availability and cost of transport.

Canberra Autonomous Car Simulation by Kent Fitch is licensed under a Creative Commons Attribution-NonCommercial 4.0 International License. - Why the reduction of 31 sec at Nullarbor is not credible