The Capital Metro EIS modelling assumed Flemington Rd south of Wells Station Dr would be
duplicated to ease congestion caused by the single-lane merge for south-bound traffic, but
only if the tram was built, despite the cost of these road works not being included in
the final Capital Metro business case.
The ACT Government Environment and Planning Directorate noted this anomaly, which unfairly
penalises the "without tram" car round-trip times in 2021 by 9.5 minutes. The first graph shows the EIS
data, the second estimates round-trip times if the Flemington Rd duplication is applied
to both scenarios.
ACTION 2015 Routes and Services: ACTION Route Website, accessed 1 December 2015. Average travel times for ACTION Red Rapid services between Gungahlin and Civic
between 06:30 and 09:00. "Express Red Rapid" is the Route 202 non-stop service.
On the 2021 car commuter round-trip times, the ACT Government Environment and Planning Directorate also noted this anomaly in their response to the EIS. The EIS preparation team explained that the "base" (no tram) times were longer due to delays at Wells Station Drive arising from the two-to-one-lane merge just south of Wells Station intersection:
The travel times listed in Table 10.6 and Table 10.9, including for the Gozzard Street to
Well Station Drive section in the Base case AM scenario, are correct.
The travel time for the southbound AM peak travel on this section was forecast to be
higher in the Base Case compared to the Project Case, primarily due to congestion
experienced at the Well Station Drive intersection as a result of the two to one lane
merge just south of the intersection.
In the Project Case, this section of Flemington Road is proposed to be upgraded to two
lanes south of Well Station Drive, removing the congestion, and resulting in the Project
Case performing better than the Base Case.
That is, the tram "Project" case reduces travel time by 9.5 minutes on this section by assuming construction of additional road lanes on Flemington Road will be required as part of the project. A fairer comparison would assume these road lanes were also constructed in the "base" case, greatly reducing the 16:58 road journey time from Gozzard to Wells Station. Note, the Capital Metro Business Case does not include the cost of these road works.
ACTION 2015 costs: The Canberra Times, 27 October 2015, quotes
a review of ACTION operations stating a public subsidy of $7.20 per passenger boarding being 83% of the
cost, giving a total cost per boarding of $8.67.
Tram costs based on forecasts of Capital Metro Business Case being met. The "agency costs" of
running Capital Metro have already
increased since the Business Case was released.
Shared automonous car costs based on 45 cent flagfall and 25 cents/km for a 12 km journey, including
complete commercial costs and operator profit.
See Canberra Autonomous Car Simulation for full details and comparisons
with other autonomous fleet cost projections which simulate very similar costs.
The ACTION 2014 timetable before construction work on Constitution Av simulated one lane traffic (for example, Route 4), shows 8 minute
travel time from Russell to Civic (and also Civic to Russell) during lunchtime.
ACTION 2015 services to Russell: ACTION Routes by number - see routes 4, 5, 9, 11, 200 and the peak hour express services 251, 252, 259 712, 714, 717, 743, 744, 765, 767, 775, 791, 792.
Simon Corbell, seemingly oblivious to the current excellent frequent and fast ACTION services connecting Russell,
promoted their replacement by fewer and slower trams:
"Thousands and thousands of public servants – isolated in Russell right now, where they cannot
connect to the city centre easily and effectively, even during their lunch hour.
So let's look at the opportunity that comes from connecting them now."
AM and PM cumulative delays at intersections on the route increase by 614
hours each day, or 44% with light rail in 2021, compared to the "no light rail" scenario in
2021 according to modelling performed by Capital Metro for the EIS (more details).
ACTION buses travelled 25.6 million km in 2014-15, and used 11 million litres of diesel
and CNG to do so. Hence, “freeing up” one million km can be expected to save 1/25.6th,
that is 430 kL of fuel, equating to 1160 tons of greenhouse gases (CO2-e) (based on the
EIS calculations, referenced below), which seems like a good thing to do.
Capital Metro's estimate of 3,000 new public transport boardings across the network attributable
to light-rail by 2031 implies an annual saving of 1210 tons of greenhouse gases (CO2-e) from travellers
foresaking cars for the tram.
However, Capital Metro's modelling of addition road congestion caused by the tram indicates
an additional 780 tons of greenhouse gases (CO2-e) will be generated by vehicles delayed
at intersections along the proposed route.
The net annual reduction is 1591 tons of greenhouse gases (CO2-e), which will reduce
over time as the vehicle fleet transitions to low emission and eventually, zero tailpipe emissions.
However, by 2021, ACTION would probably be following many other jurisdictions around
the world in replacing diesel and CNG powered buses with electric buses, able to use the
same 100% renewable power as the light rail, so these savings may be much smaller or
even zero.
The carbon statement contained with the
Capital Metro Development Application
asserts construction of the light-rail route will generate the equivalent of 60,864 tons of carbon
dioxide equivalent greenhouse gases.
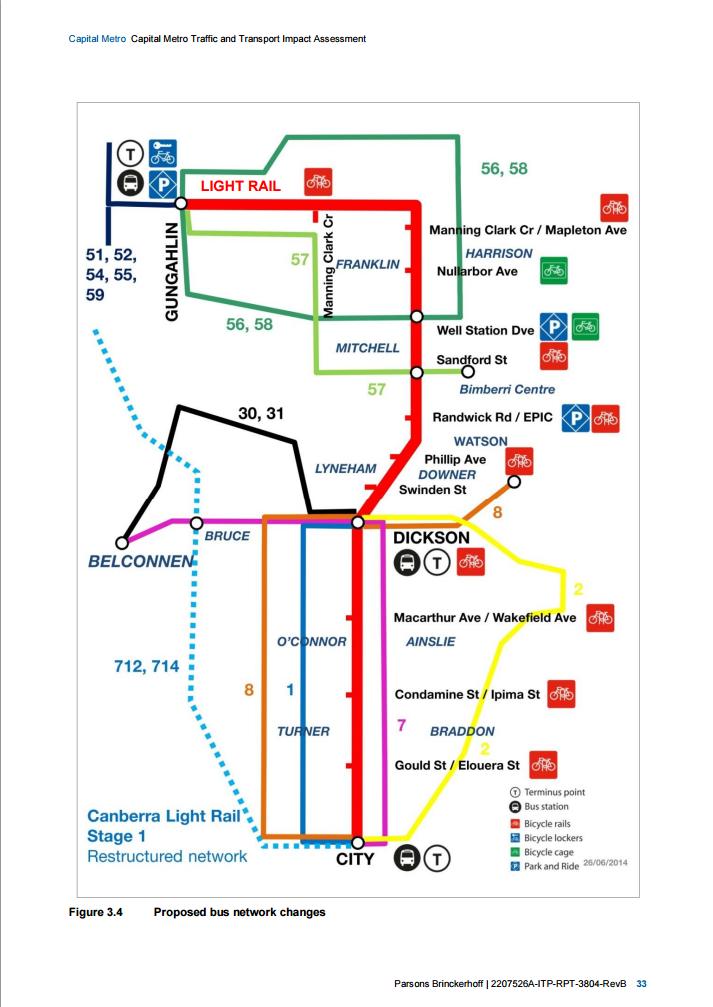
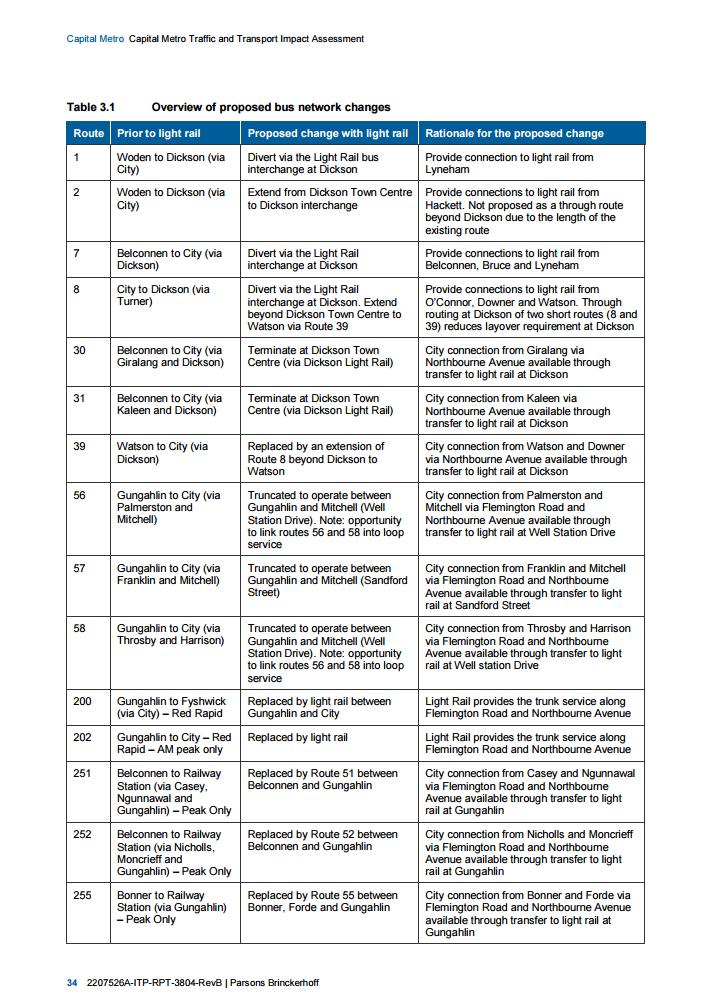
There are currently 68 bus services running between Gungahlin Town Centre and Civic each weekday morning from 6:30 until 9:00
(Route 56 - 8, Route 57 - 8, Route 58 - 9, Red Rapid 2xx - 43).
These will all be replaced by 22 or 23 tram services, running on one route down Flemington Dr to Federal Highway, then to
Dickson and Civic. There will be no buses at all running on Flemington Dr south of Wells Station Rd, or on Northbourne Av
north of Antill St.
So, the three separate routes currently running straight down Flemington and through Franklin, Harrison, Mitchell are all
to be replaced by the tram, and routes 56, 57, 58 will run as "feeder" services. Routes 56 and 58 form a loop crossing the tram
at Gungahlin Town Centre and Wells Station. Route 57 services Mitchell from Gungahlin Town Centre, crossing Flemington only at Sandford St, but there will be no tram stop at Sandford St, making it very awkward to travel between Mitchel and North Canberra.
There are currently 68 bus services running between Gungahlin Town Centre and Civic each weekday morning from 6:30 until 9:00
(Route 56 - 8, Route 57 - 8, Route 58 - 9, Red Rapid 2xx - 43).
The average ACTION bus
carries 45.4 people seated, 25.5 people standing, and 2 bicycles. (Bicycle racks will fitted to 98% of the fleet
very soon.)
These buses will all be replaced by 22 or 23 tram services, running on one route down Flemington Dr to Federal Highway, then to
Dickson and Civic.
The tram configuration is not finalised, but based on tender requirements, the trams will be 33m long and will probably carry
4 bicycles and between 48 and 60 people seated and between 136 and 148 standing. Although it is unlikely there will
be as many 60 seated, it is used in this Infographic as a "best case" figure.
Public transport capacity per 1000 residents
The primary purpose of the AM peak service will be to carry passengers from Gungahlin to North Canberra and beyond.
To calculate the capacity per 1000 residents for 2015, the current Gungahlin population size and the current ACTION bus
capacity on the Gungahlin to Civic routes was used.
Average combined AM and PM peak period vehicle speed over the road network around the proposed route (not just traffic on the direct route) decreases from 27.8 km/hr without light-rail to 23.1 km/hr with light-rail.
The EIS's analysis of intersection performance over AM and PM peaks shows that the combined number of intersections at which traffic will exceed capacity more than triples from 2 without light-rail to 7 with light-rail.
Further, the combined number of intersections which will be operating at the limits of their capacity doubles from 3 without light-rail to 6 with light-rail.
The ACTION 2014 timetable, before construction work on Constitution Av simulated one lane traffic (for example, Route 4), shows an 8 minute
travel time from Russell to Civic (and also Civic to Russell) during lunchtime.
ACTION 2015 services to Russell: ACTION Routes by number - routes 4, 5, 9, 11, 200 and the peak hour express services 251, 252, 259 712, 714, 717, 743, 744, 765, 767, 775, 791, 792.
Simon Corbell, seemingly oblivious to the current excellent frequent and fast ACTION services connecting Russell,
promoted their replacement by fewer and slower trams, saying:
"Thousands and thousands of public servants – isolated in Russell right now, where they cannot
connect to the city centre easily and effectively, even during their lunch hour.
So let's look at the opportunity that comes from connecting them now."
Total time: 56 minutes, leaving 4 minutes at the cafe to order and eat lunch.
By way of comparison, each ACTION bus trip is 8 minutes, saving 7 minutes each way, and average ACTION bus wait time
is 3 minutes (10 services per hour), saving 2 minutes each way, for a total round-trip saving of 18 minutes.
As a result, catching a bus means you have 22 minutes, rather than 4 minutes, to eat your lunch and still get back to your
desk at Russell within an hour..
The ACTION 2014 timetable, before construction work on Constitution Av simulated one lane traffic (for example, Route 4), shows an 8 minute
travel time from Russell to Civic (and also Civic to Russell) during lunchtime.
ACTION 2015 services to Russell: ACTION Routes by number - routes 4, 5, 9, 11, 200 and the peak hour express services 251, 252, 259 712, 714, 717, 743, 744, 765, 767, 775, 791, 792.
ACTION 2015 services from Gungahlin to Civic, 06:30 - 09:00: ACTION Routes by number - see Red Rapid services. The express 202 route has an average journey time of 22.5 minutes. The average journey time of all Red Rapid services is 29.6 minutes.
The Capital Metro Business case then promised a 25 minute journey, at an average speed of 28.8 km/hr. However, the speeds required
have yet to be approved by the rail safety regulator, and the traffic signal priority required is the cause of much of the
congestion and delays light-rail will bring to North Canberra's road network.
The just-completed Gold Coast light-rail has an average journey speed of 21 km/hr, but has a slightly higher station density.
Correcting for the fewer stations on Capital Metro gives an estimated journey time of 32 minutes.
For more details, see the discussion here and here.
ACTION 2015 costs: The Canberra Times, 27 October 2015, quotes
a review of ACTION operations stating a public subsidy of $7.20 per passenger boarding being 83% of the
cost, giving a total cost per boarding of $8.67.
Tram costs based on forecasts of Capital Metro Business Case being met. The "agency costs" of
running Capital Metro have already
increased since the Business Case was released.
Shared automonous car costs based on 45 cent flagfall and 25 cents/km for a 12 km journey, including
complete commercial costs and operator profit.
See Canberra Autonomous Car Simulation for full details and comparisons
with other autonomous fleet cost projections which simulate very similar costs.
AM and PM cumulative delays at intersections on the route increase by 614
hours each day, or 44% with light rail in 2021, compared to the "no light rail" scenario in
2021 according to modelling performed by Capital Metro for the EIS (more details).
Greenhouse gases caused by intersection delays will increase by more than this however, because
vehciles will need to brake and accelerate more frequently under the high congestion conditions
caused by light-rail.
ACTION buses travelled 25.6 million km in 2014-15, and used 11 million litres of diesel
and CNG to do so. Hence, “freeing up” one million km can be expected to save 1/25.6th,
that is 430 kL of fuel, equating to 1160 tons of greenhouse gases (CO2-e) (based on the
EIS calculations, referenced below), which seems like a good thing to do.
However, by 2021, ACTION would probably be following many other jurisdictions around
the world in replacing diesel and CNG powered buses with electric buses, able to use the
same 100% renewable power as the light rail, so these savings may be much smaller or
even zero.
Capital Metro's estimate of 3,000 new public transport boardings across the network attributable
to light-rail by 2031 implies an annual saving of 1210 tons of greenhouse gases (CO2-e) from travellers
foresaking cars for the tram.
However, Capital Metro's modelling of addition road congestion caused by the tram indicates
an additional 780 tons of greenhouse gases (CO2-e) will be generated by vehicles delayed
at intersections along the proposed route.
The net annual reduction is 1591 tons of greenhouse gases (CO2-e), which will reduce
over time as the vehicle fleet transitions to low emission and eventually, zero tailpipe emissions.
The carbon statement contained with the
Capital Metro Development Application
asserts construction of the light-rail route will generate the equivalent of 60,864 tons of carbon
dioxide equivalent greenhouse gases.
