• Introduction
  • Simulation
  • Discussion of simulation results
  • Notes
  • Simulation of traffic at the Northbourne/Mouat Intersection with and without light rail, 2021 and 2031

    [Part of "A brief analysis of Capital Metro's business case for light-rail"]

    Summary

    Introduction

    This simulation of traffic at the Northbourne/Mouat-Antill intersection in Canberra's north is an "isolated" simulation: although this intersection is part of traffic light synchronisation in North Canberra, no attempt is made to represent traffic backing up on entry to or exit from the intersection.

    Much of the traffic from the north (top) arrives from Gungahlin, and from the Barton Highway (from Yass) and from the Federal Highway (from Goulburn). Much of the traffic from the west (left) arrives from Belconnen.

    This traffic simulation is written in javascript, using volumes and timings from the scenarios modelled in the Capital Metro Stage 1 EIS Volume 3, Part 5, Appendix B. See the notes below for more information. It is computationally demanding, but will run on modern hardware. It has been tested to run well in the latest Chrome and Microsoft Edge browsers.

    To select a different scenario (Base or Light-rail, 2021 or 2031) at any time, press Pause, then press one of the "Run" buttons. When a scenario runs to its one hour completion, a summary of the overall journeys completed and their average times and of the overall journeys completed and their average times during the last ten minutes of the simulation are written to the "Run Summary" section at the bottom of this page.

    Simulation

    Animation speed:

    Scenarios

    Intelligent Driver Model parameters
    Max acceleration m/s/s
    Max deceleration m/s/s
    Minimum Headway s
    Zero speed distance m
    Car length m
    Note: drawn length of cars does not change
    Trams per hour: 10 12 15 20
    Average completion time
     minute by minute:

    Discussion of simulation results

    Each scenario was run over 140 times using traffic volumes and signal timing from the Capital Metro Stage 1 EIS Volume 3, Part 5, Appendix B, and using the default model parameters from for the Intelligent Driver Model and, for the tram scenarios, 10 trams per hour in each direction. From each run, the first 50 minutes of journey data was ignored and from the final 10 minutes, a scatter graph of number of completed journeys was plotted against average completed journey time.
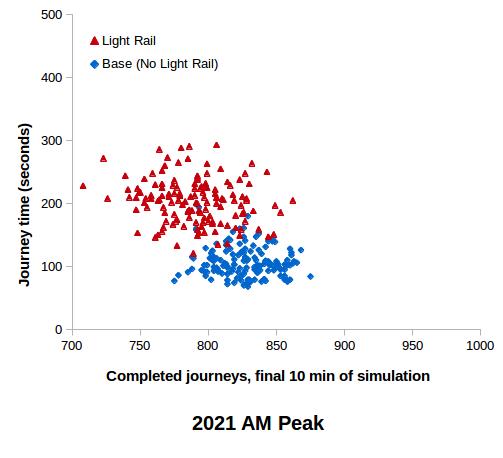
    2021 AM Peak

    Traffic volumes

    Scenario N-EN-SN-W E-SE-WE-N S-WS-NS-E W-NW-EW-S
    Base 951719161 388445158 150564153 113630606
    Light Rail 4471551144 370406172 138563201 95584563
    Change with Light Rail +352-168-17 -18-39+14 -12-1+48 -18-46-43

    The increase of 352 vehicles N-E with light rail is caused by changes at Swinden St: this turn will be less used as the service road now used to turn onto Antill will be no-longer connected to Northbourne Av.

    The big decrease of 168 vehicles N-S with light rail is probably overestimated: the modelling with light rail shows 2126 from north southbound at Swinden with a further 55 vehicles turning south at Swinden, for a combined southbound flow leaving Swinden of 2181. A total of 591 turn left or right at Mouat/Antill, leaving 1590 travelling south (not the 1551 reported by the CMA model). Nevertheless, this simulation uses the CMA model's numbers, but notes they are probably "optimistic".

    It is also unclear why the traffic originating from Mouat (from the west) is significantly less with the light rail model, as this traffic mostly originates from North Lyneham and Belconnen, areas not serviced by the light rail. This seems particularly strange, as the significant increase in the S-E traffic with light rail suggests Antill St is a much more popular destination with light rail for traffic originating from the south, but not from the west.

    Similarly, a reduction in S-N volume would be expected with the tram, but that figure is basically unchanged.

    The CMA model does not explain these difference in modelled flows. A cynic would be tempted to observe that the increases in traffic volumes with the light rail are largely with the unsignalled N-E flow and totally restricted to the lower-volume and uncongested flows, and decreases are modelled to the congested flows, despite the differences being inconsistent (as is the case with the W-E flows). Nevertheless, this simulation uses the CMA model's numbers.


    Results

    ScenarioAverage journey
    time (sec)
    Standard
    deviation(sec)
    Base (No Light Rail) 106 24
    Light Rail 204 35

    The light rail increases average intersection delay by almost 100 seconds, despite the vehicles travelling through the signalled flows falling by over 250.

    Hence ignoring flow-on effects of congestion at the new signalised intersection to the north at Swinden and the expanded crossing to the south at Murdoch, and similar increased congestion at intersections further north and south, vehicles could expect an additional 100 seconds delay at this intersection in the AM peak in 2021 if the light rail is built.
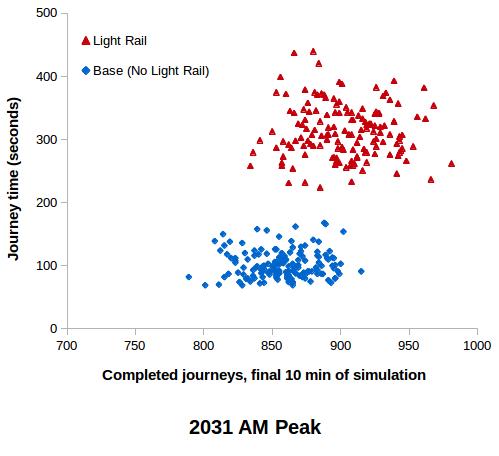

    2031 AM Peak

    Traffic volumes

    Scenario N-EN-SN-W E-SE-WE-N S-WS-NS-E W-NW-EW-S
    Base 1181765148 450406195 148655185 111649555
    Light Rail 6741907143 440411220 138679203 116641520
    Change with Light Rail +556+142-5 -10+5+25 -10+24+18 +5-8-35

    Again, the large increase of 556 vehicles N-E with light rail is caused by changes at Swinden St.

    It is unclear why the W-S traffic originating from Mouat (from the west) turning right (south) is less in 2031 than 2021, with both models.


    Results

    ScenarioAverage journey
    time (sec)
    Standard
    deviation(sec)
    Base (No Light Rail) 102 21
    Light Rail 313 42

    The light rail increases average intersection delay by over 200 seconds despite the vehicles travelling through the signalled flows increasing by just 166 vehicles (less than 4%) compared to the base case.

    It may seem strange that the average delay with 2031 Base (No Light Rail) traffic is slightly lower than the corresponding 2021 Base delay. The reasons seem to be:

    • Less signalled cross traffic in aggregate in 2031, in the model used by the CMA EIS.
    • the NS signal time is one second less in the 2031 signal timings used by the CMA EIS. This gives slightly more signal time per hour to the other traffic flows which tend to be more congested.

    Hence ignoring flow-on effects of congestion at the new signalised intersection to the north at Swinden and the expanded crossing to the south at Murdoch, and similar increased congestion at intersections further north and south, vehicles could expect an additional 200 seconds delay at this intersection in the AM peak in 2031 if the light rail is built.


    Notes

    1. This simulation uses the Intelligent Driver Model with:
    2. Traffic volumes and signal timings: Capital Metro Stage 1 EIS Volume 3, Part 5, Appendix B Base and Project 2021 and 2031 AM period tables.
    3. Signal timings (taken from the EIS model for the currently running scenario):
    4. Average Hourly Vehicle Flows (taken from the EIS model for the currently running scenario):
    5. Tram parameters:
    6. Validation of model at this intersection

      The vehicle movement and following model used in the simulation (the "Intelligent Driver Model") is widely used. However, every intersection is different, so vehicle throughput per signal phase predicted by this model were compared with observed AM peak period flows at this intersection for NS, WE and WS flows, and good agreement was observed.

    7. Inconsistency with EIS delay timings:

      This simulation reports journey times for vehicles over their route across this intersection. The CMA EIS reports intersection delay. However, this relatively minor difference does not explain the greatly increased journey times, especially for the light-rail scenarios, modelled with this simulation compared to the results reported in Capital Metro Stage 1 EIS Volume 3, Part 5, Appendix B.

      Unfortunately, as described in a subsequent smaller traffic model released by Capital Metro in Feb 2016, "Canberra Light Rail (Stage 1) Traffic Assessment Report" by Transport Modellers Alliance, the model parameters used by Capital Metro are "Cabinet in Confidence":

      The description of the base model setup for Canberra's Light Rail Project is given in the "Microsimulation Modelling" document produced on behalf of Capital Metro by Arup/Hassell/Parsons Brinkerhoff and is subject to Cabinet in Confidence restrictions.
      [Section 2.1 Capital Metro Micro-Simulation Modelling]
    8. Reducing total intersection delay with light-rail by allocating a greater percentage of green time to cross traffic

      Total intersection delay with light-rail can be reduced from the signal timings used in this simulation (taken from the Capital Metro modelling) by giving more green time to traffic originating from the east and west. However, whilst this can greatly reduce delays for that traffic, it increases delays for north-south traffic. Nevertheless, for one isolated intersection, minimising aggregate delay would be the optimal approach. However, the north-south traffic (including traffic turning onto the north-south route) will typically be traversing a dozen or more (up to 23) signals degraded by tram priority, and these delays will accumulate unacceptably for these major flows, whereas traffic crossing the tram-line will traverse fewer affected intersections.

    9. Why doesn't north-south traffic doesn't flow when a special tram phase is inserted in the cycle?

      Capital Metro are planning for "LRV only" ("Light-rail vehicle only") phases to be inserted into the usual signal cycle to give the tram priority over other traffic. (see section 3.5 of Capital Metro EIS Volume 3 Part 5 Traffic and Transport). In these phases, vehicles travelling north or south along Northbourne (in this example) will not see a green signal, as these unexpected and shorter inserted phases would cause confusion to vehicle drivers.

      Where the north-south green cycle is extended to accommodate a tram which would otherwise arrive too late for the green, the vehicle green signal is also extended.

    References

    TODO

    History

    Run summary

    A summary of completed simulations run since this page was loaded appear below:


    Creative Commons Licence
    Canberra Autonomous Car Simulation by Kent Fitch is licensed under a Creative Commons Attribution-NonCommercial 4.0 International License.